Advantages of Digital Electroencephalography in Clinical Veterinary Medicine-2
Terrell A. Holliday and Colette Williams
Veterinary Medical Teaching Hospital, School of Veterinary Medicine, University of California Davis, Davis, CA
Automated Frequency Analysis, Automated Event Detection - Topographic Mapping
This discussion is concerned with certain unique and valuable procedures that are possible using digital EEG (dEEG).
In dEEG, the continuously varying (analog) voltage changes detected by the electrodes are led into amplifiers, and then into analog-to-digital converters. The converter output consists of numerical values that are stored in a computer and are available for detailed analysis. (There are stringent requirements for the details of the digitization process but these are not discussed here.)
Digital EEGs are always recorded using a common reference montage. Thus, activity at each electrode site is referenced to a single electrode. The recordings can then be remontaged as necessary to display the data to better advantage. ("Remontaging", a very valuable feature of dEEG, has been discussed earlier.)
Specific Uses of Digital EEG:
1. Analysis of background rhythms (BGR) and special methods of presenting the results of analysis
a. Automated frequency analysis and objective quantitation of BGR (quantitative EEG:qEEG)
b. Graphical methods of presenting information about BGR.
c. Statistical analysis of BGR data.
d. Continuous monitoring of BGR of surgical and ICU patients.
2. Improved methods of detecting and analyzing other aspects of EEG recordings.
a. Automated detection of transient EEG events (e.g., spikes).
b. Source analysis (more precise localization of generators of EEG events, e.g., epileptogenic foci).
c. Three-dimensional localization of EEG events within the brain, based on mathematical data and coordination with magnetic resonance imaging.
Automated Frequency Analysis of the EEG
It is essential to realize that in spectral analysis, the original waveform structure of the EEG is lost. Fisch has said: "A particular band value gives no indication of waveform morphology, nor does it give any indication of how many times a specific waveform has occurred. Thus, the same spectral band value could result from either continuous, identical, low amplitude waveforms or from intermittent high amplitude waveforms in the same frequency range". Because of the loss of waveform information, the original EEG should be interpreted carefully by an experienced electroencephalographer; if this is not done, artifacts may be included in the analysis and clinically important information may be lost, e.g., paroxysmal discharges of epilepsy or triphasic waves of metabolic encephalopathies. (Fisch1)
Frequency (second-to-second variations in amplitude and/or polarity) is one of the most important parameters of the EEG. Using simple visual inspection, an experienced electroencephalographer can provide a remarkably close estimate of the frequency content of an EEG epoch. Nevertheless, this subjective process does not provide numerical values that can be replicated exactly by another person (or perhaps even by the same person), and its resolution is limited to about that of the classical EEG bandwidths. On the other hand, one of the most common and best-established uses of qEEG is frequency analysis of the background rhythms (BGR). Digitization provides numerical values that are reproducible, have high resolution, and permit objectivity. Frequency analysis is generally applied in one of two forms: interval analysis and frequency spectral analysis. In either case an epoch of EEG is analyzed and can be compared with normal data; also, epochs made at different times can be compared allowing detection of changes over time.
Interval analysis
Interval analysisis based on measuring the intervals between zero crossings of the EEG voltage; alternatively, crossings at other levels or between minima and maxima can be used.2 It is frequently used during long term monitoring, such as during anesthesia, especially during procedures where there is concern about cerebral ischemia or hypoxemia, in studies of psychoactive drugs, and in sleep research. Frequency spectral analyses and interval analyses overlap somewhat in their results but nevertheless are distinctly different processes.3 A hybrid method called interval-amplitude analysis also has been advocated.2 The reader is referred to Lopes da Silva.2 for detailed discussion and numerous references on interval analysis.
Frequency spectral analysis
Frequency spectral analysis is a common form of frequency analysis. It uses the fast Fourier transformation (FFT), to calculate the frequency content of digitized EEG epochs. An important fundamental feature of the FFT is that the sines and cosines of the individual waves of the EEG are used to calculate "Fourier coefficients" which have either positive or negative values. The coefficients ultimately are squared, yielding only positive values.1,2
The units of wave amplitude used in calculating the FFT are microvolts (µ V), thus squaring the coefficients yields µ V2. By Ohm's law, V2 is proportional to power. The results of FFT routinely are presented as power when in fact they are not power per se but only µ V2 because they lack the impedance factor used to calculate power.It is more accurate to say that thevalues shown in thepower spectrum are proportional to the power carried within each frequency. Occasionally, the units used are watts, the standard units of electrical power.1 In either case, the spectrum is most often referred to as "frequency power spectrum" (and the slight untruth is accepted by readers, manuscript reviewers and editors).
Graphical Presentation of Frequency Analyses.
In calculating the FFT, squaring the coefficients affects the appearances of the various frequencies because, after squaring, the heights of the various values are changed disproportionately. This can be at least partially overcome by using the square roots of the squared values. The resulting values (volts) are referred to as the "amplitude spectrum". Some electroencephalographers find amplitude spectra somewhat easier to relate mentally to the more familiar "raw" EEG record than are the power spectra.2
The data routinely are presented as line graphs or histograms with frequency plotted on the abscissa and voltage on the ordinate. Sometimes V, V2, or even frequency, are plotted logarithmically.2 This helps to overcome some of the scaling problems associated with simple linear graphing of the data.
Displaying and Comparing Data Recorded at Specific Times
Samples of data recorded during specified periods, e.g., during sleep stages, or at specified periods after administration of a drug, can be displayed graphically in several forms. These include:
Absolute band power or amplitude
 Absolute band amplitude: the area under the curve of the amplitude spectrum within the bandwidth under consideration.
Absolute band power: the area under the curve of the power spectrum within the bandwidth under consideration.
Mean amplitude or power of frequency bands within epochs can be calculated and displayed.
Relative band power or amplitude
Relative band amplitude is calculated by dividing amplitude in one band by that in another. For example, amplitude in the delta band is divided by total amplitude in all bands.
Relative band power is calculated by dividing power in one band by that in another. For example, power in the delta band is divided by total power in all bands.
Certain uses of relative band amplitudes or power can be advantageous because they limit or eliminate the effects on amplitude/power caused by variations in skull and soft tissue thickness.1
Mean relative amplitude or power can be calculated and displayed using data from 2 or more epochs.
Figures 1A-1D show an epoch of EEG and analyses of the epoch using power spectrum, amplitude spectrum and "normalized" (relative) band amplitudes/or power.
Click on an image to see a larger view.
|
|
Figure 1A. EEG of a foal with a history of seizures. The amplitude is quite high and background rhythms (BGR) are slow for apparent state of arousal (NON-rem sleep) but are probably normal for the foal's age (3 weeks). Vertical dotted lines are at 1-sec intervals. Vertical dotted lines are at 1-sec intervals. Epoch subjected to frequency apectrum analysis marked by green vertical lines. |
|
|
Figure 1B. Frequency power spectrum of 8 sec EEG epoch between the green markers in Figure 1A. The exact time is shown at the top of the figure. The EEG derivations are shown in the first column. In this spectrum, the height of each bar is calculated as a proportion of the highest bar in the histogram, thus it is possible to compare derivations.
Legend
In the numerical columns, the first column shows the frequency where the highest power was found and the second column shows power at that frequency (so-called "dominant frequency"). Subsequent columns show the mean power within each of the classical EEG frequency bands. Note asymmetry in frontal regions in the delta and theta bands. |
|
|
Figure 1C. Frequency amplitude spectrum of the EEG epoch in Figure 1A. Here, nothing was changed from Figure 1B except that amplitude (square root of power) was calculated, rather than power. Note that the differences in the delta and theta bands appear less marked but the activity in the beta band (light blue in the histograms) is still not readily seen. Note asymmetry in frontal regions in the delta and theta bands. |
|
|
Figure 1D. Here the power spectrum has been "normalized". This is a form of plotting relative band power or amplitude. In each channel, each measurement is shown in proportion to the highest value in that same channel. This means that comparisons cannot be made between channels. However, in derivations where the values were relatively low in Figures 1B and 1C, e.g., in the frontal and occipital regions, (Fp1, Fp2 or O1-O2). this better displays the relative amounts of activity in the various frequency bands . In horses, the frontopolar and occipital derivations are usually of low amplitude, presumably because of the intervening bony tissue and/or the distance of the electrodes from the brain. This method of displaying frequency spectra helps to circumvent that problem. Numerical data are the same as in the power spectrum shown in Figure 1B. |
Other Analyses Sometimes Used.
The spectral edge frequency is the frequency below which lies a specified fraction of the total power or amplitude. For example, if a spectral edge of 90% is set, the computer calculates the frequency below which 90% of the area of the total bandwidth lies. Spectral edge frequencies of 90% or 95% have been used commonly in anesthesia studies as criteria for surgical depth of anesthesia.
The median peak frequency is calculated simply by setting the spectral edge frequency at 50%. Median peak frequency also has been used in some anesthesia studies. Mean peak frequency is simply the center of gravity under the spectral plot.1
For absolute peak frequency the computer calculates the highest power or amplitude in a specified bandwidth. This can be used to compare electrode derivations within the same patient in the same recording or in recordings made at different times or from different patients.1
Displaying Data Collected During Longer Periods of Time
To display data from epochs of longer duration, linear graphs of individual epochs are often "stacked" close together to form a "compressed spectral array". (Holliday and Williams, 1999) This is especially helpful in demonstrating changes when monitoring patients in sleep studies or anesthesia studies.
Statistical Analysis of qEEG Data
Despite the various, sometimes dramatic, display methods, graphic presentations of qEEG results still require human interpretation of visual data and therefore are vulnerable to subjectivity just as in conventional interpretation of the "raw" EEG. This can be reduced by statistical analysis of the numerical data itself. Various software programs allow access to the numerical data that can then be used for statistical calculations. In this regard, it is has been pointed out that samples of representative epochs have more or less constant statistical properties.2 The reader can find recommendations and precautions for performing the statistical analysis in Lopes da Silva.2
Other Uses of Digital or Quantitative EEG
Automated Event Detection (Pattern Recognition)
Digital EEG computers can be programmed to recognize interictal paroxysmal discharges (e.g., spikes) and also seizures. Programs have preset parameters that can be revised if deemed necessary; some can be operated on line during recording, or the record can be stored and analyzed later. The analysis can include calculating and displaying an average of many events. False positives can be eliminated manually after recording, and the average recalculated. Fisch remarks that the programs tend to produce many false positives but false negatives are rare.1
Click on an image to see a larger view
|
|
Figure 2. Here, a "spike detector" pattern recognition program was used to identify spikes in the EEG of a dog. In this display, events detected were automatically displayed in chronological order. A vertical black line passes through the peak of each spike and is at the center of a 1-sec epoch during which the event occurred. Vertical red lines were added here for display purposes. |
|
|
Figure 3. Here, another type of pattern recognition program allowed the operator to identify events in the recording and then ask the computer to search for similar events. It marked all events it identified and then formed an average for display. Again, the operator can exclude false positives manually. Here, a spike in the EEG of a dog was chosen as a template and the software automatically identified 70 similar events during a 30-min epoch of the recording. The software then computed the average for all events at each derivation. |
Topographic Mapping
"Topographic mapping" (TM) refers to various methods of displaying recorded EEG signals or the results of EEG analyses superimposed upon images of the head or brain. Digital EEG aids in constructing certain of these displays automatically. In general, the display shows the distribution over the scalp either of EEG events at a specific instant, background rhythms during specified periods, e.g., sleep stages, stages of anesthesia, etc., or the distribution of voltages over the surface of the head at specific instants. Note that TM is merely a display method and is not, in itself, analytical. However, the results of some analytical methods are advantageously displayed topographically.
These methods are based on the concept of "slabs" of cortical tissue that form "dipole layers".4 A single arrow can be drawn through a dipole layer to represent the sum of all the actual dipoles in the layer; this is referred to as an "equivalent dipole". When used with a suitable model of the head, equivalent dipoles allow more precise localization of the actual event.
A widely used form of improved localization of focal EEG events is called source derivation. It is not, in itself, a mapping technic; however, some mapping techniques use the principles of source derivation.In this technic, electrode derivations are arranged so that activity at surrounding electrodes is smoothed relative to the activity at a given exploring electrode, which is thereby enhanced. Source derivation has been adapted and greatly strengthened using digital EEG methods, leading to topographic mapping clearly demonstrating EEG events that can only be surmised in analog EEG recordings.
Types of Topographic Mapping
All graphic forms of the data can be displayed adjacent to or superimposed on drawings of the head. For example, a short epoch of EEG recorded during a focal paroxysmal discharge may be superimposed on a drawing of the head to show the tracings recorded at the time at all electrode positions. Superimposing the recordings over an MRI or CT image of the head or brain sometimes provides a striking display.
An example of an advanced topographic method showing events before, during and after a paroxysmal discharge is shown in Figure 4.
Click on the image to see a larger view
| Figure 4. | 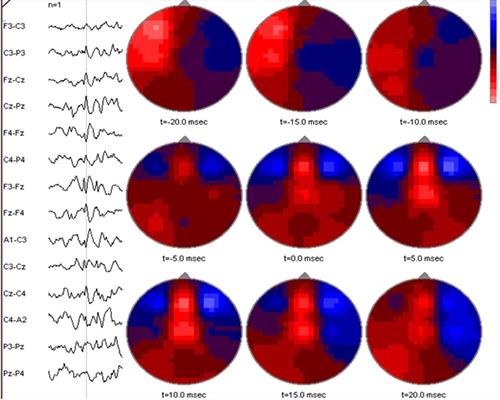
A spike (part of a spike-and-wave complex) in the EEG of a foal, detected by spike detection software, is shown at the left. The software then calculated events over the entire dorsal aspect of the head at 20 msec intervals before and after the event. Red (light) areas are negative and blue (dark) areas are positive. At t-20 msec there is a large area of negativity in the left fronto-parietal region. This subsides during the next 10 msec. At t-5 msec, a new area of negativity appears in the frontal midline region; during the remainder of the period this activity increases and then finally begins to subside. The software bases its calculations on a spherical model of the human head, thus is not anatomically applicable for the foal's head, although midline locations are probably reliable. |
|
| |
Laplacian Methods
These are special methods of displaying EEG recordings that are especially useful for enhancing localized waveforms and filtering out widespread coherent waveforms.1 In these methods, each electrode is referenced to the average of an ensemble of other electrodes. In forming the "average", the "weight" assigned to each electrode included in the reference ensemble is inversely proportional to its proximity to the exploring electrode. The voltages measured in this manner are entered in the Laplacian, an equation used to calculate the curvature of lines. The data then is used to construct "maps" showing curved lines that connect points calculated to have equal voltage; importantly, points can fall between actual electrode sites. The exact method of weighting electrodes and of calculating the results and presenting them varies somewhat among users of the method, thus differences in results can occur.5
The logic behind these methods is simple enough. In reality, the EEG consists of nothing more than the changes in voltage recorded at the exact sites of the electrodes. During visual interpretation of analog EEGs, one usually assumes that the voltage at points between any two electrodes was intermediate between the voltages measured at the electrodes. These assumptions actually are mental "interpolations" (and therefore are inherently subjective).
The computer uses the digitized EEG data to produce an image of the head that shows curved lines connecting points calculated to be of equal voltage. The lines are called "spline lines", (after the "spline", a long, flat, pliable strip sometimes used to form curves in drawings), and the maps produced are called "spline maps". In reality, the lines are nothing more than computer-calculated interpolations, thus they too are estimates. Their accuracy is directly proportional to the number of electrodes used to gather the data. Spline maps also can include the ventral aspect of the head where they are, in fact, extrapolations because they extend beyond the measured points (i.e., beyond where electrodes can be placed over the lateral and dorsal regions of the head). (Figure 5)
Click on the image to see a larger view
| Figure 5. | 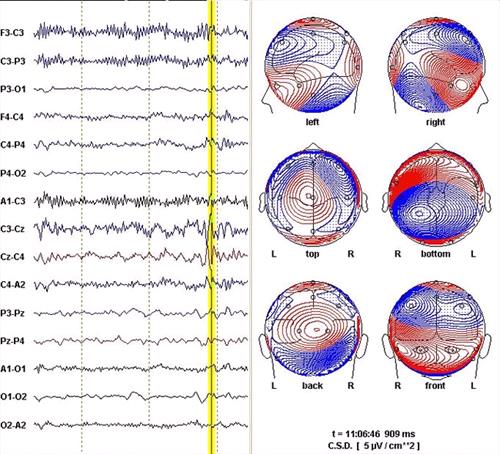
EEG epoch from a foal and associated spline map. The position of the vertical yellow line marks an instant during a spike-and-wave complex. The software has calculated "current source density" (CSD) spline maps depicting the calculated distribution of currents visible in a various views of the head at the time marked. The spline lines connect points on the head calculated to be isopotential. The closer the lines are to one another, the steeper the current gradient. The maps are very complicated because the event is complicated.
The 10 sec epoch usually displayed by the software was cropped here to fit the figure to the page without excessively reducing the EEG. |
|
| |
Certain points to note
1. Some electrodes cannot be fully surrounded by "reference" electrodes simply because they are at the edges of the areas of the head on which electrodes can be placed. Some software programs will estimate (extrapolate) voltages for these missing points.
2. Some software will calculate voltages for locations where electrodes are missing or tracings have been deleted because of artifacts.
3. In all cases, the data used is derived from recordings made with reference montages, thus the fact that there is no such thing as an "inactive reference" must not be forgotten when devising Laplacian montages or when interpreting the maps so produced.
For human EEG, spline maps are based on a model that assumes the cranium is a sphere or an ovoid. Recognizing that neither shape is wholly realistic, researchers have expended much effort to improve the models without reaching universal agreement on any particular model. Despite the acknowledged limitations, spline maps have value in understanding some important aspects of the human EEG. Unfortunately, the software with present day digital EEG machines is not directly applicable to the anatomy of domestic animals.
Ideally, precise localization of focal abnormalities includes not only the location on the surface of the head but the depth and orientation of the source (equivalent dipole) as well: i.e., a three-dimensional localization. Research now is directed at developing models formed from MRI of the individual patient. Such models, showing the patient's head and the brain remove the problems associated with "one size fits all" models and can show the three-dimensional location and orientation of equivalent dipoles with accuracy of only a very few millimeters. With this degree of accuracy, surgical excision of epileptogenic foci becomes possible. The same technic can be applied to animals.
References
1. Fisch BJ in: Fisch and Spehlman's EEG Primer, Third Edition. Elsevier, New York, 1997, Ch 7, p 123-138.
2. Lopes da Silva F. in: Niedermeyer, E and Lopes da Silva, F. Electroencephalography. Fourth Edition. Lippincott, Williams and Wilkins, Philadelphia, 1998. Ch 61, p1135-1163.
3. Reynolds CF III Brunner D. Sleep microarchitecture in depression: commentary. Biol Psychiatry. 1995 Jan 15; 37(2):71.
4. Holliday TA in: Proceedings, Biannual Course in Veterinary Neurosciences and Advanced Clinical Neurology/Neurosurgery, 2003.
5. Lagerlund TD in: Niedermeyer E and Lopes da Silva F. Electroencephalography. Fourth Edition. Lippincott, Williams and Wilkins, Philadelphia, 1998. Ch 46, p 809-822.