Volume Conduction Principles in Clinical Neurophysiology: How To Tell Up From Down and Read Those Squiggly Lines
T. A. Holliday DVM, PhD
Veterinary Medical Teaching Hospital, Department of Surgical and Radiological Sciences, University of California-Davis, Davis, CA
Although the discussion here is limited to clinical neurophysiology, the concepts described apply to all forms of electrophysiology. They provide an integrated basis for understanding the way in which bioelectric currents from any source are conducted in tissues and how this determines the appearance of the potentials recorded. The same concepts form the basis for topographic mapping of the EEG and evoked potentials, tools that doubtlessly will soon be applied in veterinary medicine. Proper use of all electrophysiological techniques requires understanding these principles to better understand and interpret the recordings obtained.
Clinical neurophysiology deals with the detection, recording and interpretation of bioelectric currents arising from the nervous system and from muscles. There are two basic types of current sources to consider:
1. Moving sources: action potentials that travel along nerve fibers or muscle fibers. In these cases the action potentials consist of active zones which move along a cable-like structure while other parts of the structure remain electrically silent. Examples: nerve action potentials; electromyographic (EMG) potentials.
2. Stationary sources: action potentials that arise from nonmoving sources such as nerve cell bodies or their dendrites. Examples: the normal waves of the electroencephalogram; spikes or spike-and-wave complexes in the EEG; major parts of evoked potentials such as auditory, visual or somatosensory evoked potentials and the cord dorsum potential. These often are referred to as field, or sink/source potentials.
Four important concepts apply to both sources, moving and stationary:1. Dipoles; 2. Volume conduction; 3. Solid angles; 4. Summation of solid angles.
1. A dipole is simply a separation of unlike charges. By definition, dipoles have polarity, one pole being negative and the other positive (or at least, less negative). In a conductor, when charges are separated current will flow; this results from the natural attraction of opposite charges and the repulsion of like charges. (Figure 1)
|
|
Figure 1. A hypothetical dipole, drawn here as a disk forming a "dipole layer", in a volume conductor (blue). The charges have been separated so that the upper side of the disk is negative, the lower side positive. Electrode E 1 "sees" only negativity; Electrode E 2 sees only positivity. The voltage recorded by each electrode is proportional to the product of the solid angle (Ω 1 or Ω 2) and the actual voltage of the dipole. Note: even though the cross-sectional area of the dipole layer is the same on both sides, the voltages measured by the two electrodes would differ from one another in amount as well as in polarity because the solid angles are different.
The equation yielding the voltage at either electrode is:
V = Ω (e/4 π) V = voltage measured at recording electrode; Ω = solid angle; π= pi (3.1416);
e = voltage measured between surfaces of the dipole.
The solid angle concept is consistent with everyday experience: the larger an object is, the larger is its apparent size (solid angle) when seen from any given distance. Conversely, the closer an object is, the greater is the apparent size (solid angle) presented to the observer. |
2. Volume conduction of electrical events in the body. The tissues of the body can and do conduct electricity. The body and its parts are 3-dimensional structures and therefore have volume. Electrical currents spread (are conducted) throughout this volume, thus it is correct to speak of "volume conduction" of electricity in tissue. Because of the conductivity of tissue, at rest the volume conductor formed by the body is of equal potential (isopotential) at all points. When a dipole is formed, current flows until isopotentiality is reached.
3. Solid angles. A solid angle is a measure of the apparent cross-sectional area of an object as viewed from a point. Dipoles have amplitude (measured in volts). Solid angles are important in measuring the amplitude. As measured by an electrode in a volume conductor, the measured amplitude of a dipole is proportional to the product of the solid angle it presents to the electrode and the actual voltage difference as measured between the poles (Figure 1).
4. Summation of solid angles. The solid angles formed by individual axons, myofibers or neurons are too small to permit making useful recordings of their activity with the relatively remote electrodes required in clinical neurophysiology. Summation has been emphasized by Gloor 3 in the case of EEG potentials. It is true also for recording the action potentials of peripheral nerve and spinal cord axons. It is apparent that another factor must operate to provide the recordings that are routinely obtained. In fact, these are obtained through summation of the individual dipoles. The specific ways in which summation is achieved for nerve, muscle and EEG potentials are described below in the sections pertaining thereto. (In EMG, fibrillation potentials and positive sharp waves are recorded routinely; this is true also for the potentials of single fiber EMG. However, this occurs only when intramuscular electrodes are used and they are located near the active muscle fibers.)
What about the membrane potential?
Membrane potentials consist of small dipoles, one pole inside the membrane, the other outside. Restingmuscles and nerve fibers are "electrically silent" despite their membrane potentials. No current flows in or around quiescent (resting) cells. These do not influence the potential measured at external points because all points outside the cell are faced by equally but oppositely charged surfaces; that is the solid angle "seen" by the recording electrode contains equal amounts of positive and negative charges (Figure 2).
|
|
|
Figure 2. An imaginary scene showing why an electrode recording from a volume of tissue registers zero when the tissue is at rest: An axon or muscle fiber in tissue (a volume conductor) has been split longitudinally and its parts separated. Electrode E-1 registers negativity because it "sees" only the negative sides of the dipoles formed by the separation of charges across the membrane (the membrane potential). Electrode E-2 sees only the positive sides of the dipoles and therefore registers positivity. After "reassembly" of the structure, electrode E-3 sees the positive ends of the dipoles at the upper membrane and the negative ends of those at the lower membrane, therefore it registers zero. (After Woodbury; Gloor3,5) |
All parts of this presentation rely heavily on previous papers by Gloor and Knott1-3. Additional important information can be found in Lorente de No and Woodbury4,5. In the following sections: Part A deals with the configurations and amplitudes of moving current sources such as muscle fiber potentials, nerve potentials, and spinal cord ascending evoked potentials. Part B deals with the stationary potentials of the EEG. Part C, deals with the cord dorsum potential and Part D with wave I of the brainstem auditory evoked potentials.
Part A: Moving Sources
Action Potentials of Axons and Muscle Fibers ("Cable Potentials")
The important principles that apply in volume conduction of potentials in axons or myofibers are:
During all-or-none action potentials in axons or myofibers the membrane does not simply depolarize, it actually reverses polarity. An "active zone" is created where, for a brief period, the interior of the cell is positive with respect to the exterior; it then returns to the resting state. The active zone is transmitted as a pulse in a linear fashion along the course of the structure while the remainder of it is inactive. The axons or myofibers can be viewed as "cables" conducting moving dipoles.
Actually, because tissue is a good conductor, currents are conducted throughout the body: a body-wide electrical field is created. However, only currents in the immediate vicinity of the dipoles need be considered. The amplitude of these potentials, when recorded at more distant points, such as the recording electrode, is proportional to the amplitude of events at the dipole.
The amplitude of the potential recorded by the electrode is proportional to the solid angles, as measured from the recording electrode, and the actual amplitudes of these dipole layers (Figure 1).
1. Dipole formation. Active axons or myofibers set up electrical currents in the extracellular space as well as in the intracellular space. The presence of current flow indicates that a difference of potential (separation of charges or dipole) exists and positive and negative charges are flowing toward one another. In the case of a nerve or muscle fiber, dipoles exist at the points where membrane potential changes occur, i.e. the leading edge and at the trailing edge of the active zone:
At the leading edge of the active zone: In contrast to the resting state, the polarity reversal of action potentials in axons or myofibers produces areas where the electrode does not see equal amounts of positivity and negativity. Rather, the electrode sees areas where positivity predominates and/or areas where negativity predominates. The electrode still sees the inactive zones as isopotential because they are still in the resting state. Only at the leading and trailing edges does it see inequality of the dipoles. The amplitude of the inequality is proportional to the solid angles presented to the electrode. Importantly, the solid angle presented by the wave front, or by the trailing edge, is also proportional to the recorded potential and it is this latter point that Woodbury and others have used in explaining the final configuration of action potentials in "cables". (Figure 3x)
Click on the image to see a larger view.
|
|
Figure 3x. A hypothetical case where the electrode (E) "sees" an approaching action potential in an axon or myofiber. The relevant solid angles are:
A, the active zone, where polarity reversal is occurring. B, The area where polarity has reversed and the electrode sees equal amounts of negativity and positivity, thus the area does not contribute to the event recorded. C, This area is still in the resting state and therefore does not contribute to the event recorded.
The voltage seen by the electrode is proportional to solid angle A and in turn is proportional to the solid angle formed by the electrode's view of the cross-section of the axon or myofiber (blue vertical line). |
At the trailing edge, where the membrane potential is re-established, changes occur that are exactly the same as at the leading edge, they are opposite in polarity to those shown in Figure 3x.
Summation. In clinical neurophysiology, the action potentials of single axons or myofibers form solid angles that are too small to be detected individually unless the recording electrode is very close to the current source. Under the usual recording conditions, these events become detectable only by summation of the solid angles of numerous individual dipoles. The means by which summation of the individual action potentials in cable potentials occurs is illustrated in Figure 3xx.
Click on the image to see a larger view.
|
|
Figure 3xx. Individual solid angles of axons or myofibers are too small to be detectable by an electrode at a distance. However, the electrode "sees" all such events and records the algebraic summation of the individual solid angles. For simplicity, only the solid angle of the "leading edge" of the active zone is depicted here, actually the electrode sees the leading and trailing edges. Blue: active zones of the fibers; Green: inactive zones; Red: solid angle seen by electrode, this is proportional to the length of the blue bar. |
It is helpful to apply these ideas first to the simplified, hypothetical case of a propagating nerve impulse that undergoes reversal of polarity without repolarizing (as occurs normally). This is illustrated in Figures 3A-3E. Please note that in the illustrations of cable potentials below, only single structures are drawn; these represent the summated activity of multiple axons or myofibers.
As you examine the figure, note that as the wave front approaches, passes by the electrode and moves off into the distance, the solid angle increases from zero, then reverses and decreases to zero. It then increases in the opposite direction, only to decrease to zero again eventually. Therefore the potential "seen" by the electrode does likewise: it increases to a peak, decreases to zero then increases to a peak in the opposite direction, then eventually returns to zero. The net result in this hypothetical example is a sinusoidal, diphasic potential, first positive, then negative. In each figure, there is an inset that shows changes in the hypothetical "action potential" with red approximating changes which have occurred up to the time represented in the figure and white showing the configuration of the entire potential after it is completed.
For simplification, the polarity changes are considered to be instantaneous and to be confined to places in the axon or myofiber having zero length. Also, the solid angles are represented by simple planar angles; it is assumed that the cross-sectional dimension of the "cable" (axon or myofiber) is constant, therefore the solid angles are proportional to the angles shown on the drawings.
Click on the image to see a larger view.
|
|
Figure 3A. An electrode at E detects a voltage at the dipole formed at the point where polarity is reversing (indicated by the vertical blue line). The solid angle is proportional to the apparent cross sectional area of the dipole as "seen" by the electrode. In the region where polarity has reversed (yellow), the negative charges on the side nearer the electrode are offset by the positive charges on the side farther from the electrode (just as in Figure 2). In the still quiescent area (green), opposite distribution of charges occurs but with the same effect as in the yellow zone. Thus neither the quiescent zone nor the zone where polarity has reversed contribute to the voltage at any given instant. Only the active zone contributes. The measured voltage is positive because the electrode sees only positivity in the solid angle. |
|
|
Figure 3B. Here, the depolarizing wave has moved somewhat to the right, resulting in a smaller solid angle of the red area. In the interval between 3A and 3B, the solid angle and the measured voltage registered a maximum, then decreased, therefore the electrode now registers less positivity then earlier. |
|
|
Figure 3C. Here, the wave front has moved directly beneath the electrode, the solid angle is zero and the electrode registers zero. |
|
|
Figure 3D. At this time, the wave front has moved on to the right; the electrode now sees negativity. |
|
|
Figure 3E. Here the wave has moved still farther to the right. The point of maximum negativity has been passed and the solid angle is diminishing. It will continue to do so, reaching zero when it reaches the end of the cell, unless something interrupts the process. |
The net result of this imaginary event is a diphasic, sinusoidal waveform, first positive, then negative.
But in fact, action potentials do not simply reverse polarity, as in the preceding example.
Instead:
1. Action potentials form a "zone" in the axon or myofiber. At one end of the zone, the potential is reversing polarity and at the other end polarity is returning to the resting state.
2. Hence the recording electrode "sees" two wave fronts, one the "leading" edge the other the "trailing" edge; these are undergoing opposite activities. The area between the leading and trailing edges is electrically quiescent.
3. The potential registered by the electrode is the algebraic sum of the two "edges". These points are illustrated and explained in Figures 4A-4G, which show the amplitude and polarity changes in axons or myofibers when a hypothetical action potential arises remotely, off the screen to the left, and is propagated horizontally across the screen and off to the right. In these figures, the action potential has a leading edge identical to that shown in Figure 3 but in Figure 4 it also has a trailing edge, where repolarization occurs. Events in the trailing edge are the reverse of those in the leading edge, and produce the reciprocal of the events shown in Figure 3. At all times, the electrode "sees" the algebraic sum of events at each end of the active region. This process results in a triphasic action potential that is first positive, then negative, then positive. It eventually reaches zero when it reaches the end of the fiber or is otherwise stopped.
Please note the following about Figures 4A-4G:
A. The inset in each figure shows changes in the hypothetical "action potential" with red approximating changes which have occurred up to the time represented in the figure and white showing the triphasic configuration of the entire potential after it is completed.
B. For simplification, the polarity changes are considered to be instantaneous and to be confined to places in the axon or myofiber having zero length.
C. The solid angles are represented by simple planar angles; it is assumed that the cross-sectional dimension of the "cable" (axons or myofibers) is constant, therefore the solid angles are proportional to the planar angles.
D. The solid angles of the leading edges are colored red and those of the trailing edges are colored yellow.
E. There are areas where the angles overlap, these are colored orange and bounded by yellow or red lines; such areas are largely a result of the width versus length ratios demanded by the computer display properties.
F. Because of the limited space, in some figures it was necessary to move the location of the electrode within the drawing and change the horizontal dimensions of the drawing.
Click on an image to see a larger view.
|
|
|
Figure 4 A. Here the active zone is relatively distant from the electrode (E). The electrode sees positivity at the leading edge of the active zone and negativity at the trailing edge; where solid angles overlap (orange) positivity predominates. At this time, the electrode registers positivity. |
|
|
|
Figure 4B. Here the active zone has moved closer to the electrode, reaching maximum positivity, the solid angles now will diminish and positivity will lessen. |
|
|
|
Figure 4C. Now the active zone has moved even closer to the electrode, and the algebraic sum registered by the electrode has entered the negative phase. |
|
|
|
Figure 4D. Here, the active zone is directly under the electrode, the solid angles are equal and the electrode sees only negativity. The action potential has reached its negative peak. |
|
|
|
Figure 4E. Now the active zone has moved farther to the right. The solid angle of the leading edge is still larger than that of the trailing edge so the electrode still registers negativity, although less than at the peak shown Figure 4D. |
|
|
|
Figure 4F. At this time the solid angles are about equal and the electrode registers near 0. |
|
|
|
Figure 4G. Finally, both solid angles have reached maxima and have begun to diminish. The recorded potential has reached a peak of positivity and will become smaller and smaller, approaching but not reaching zero until it reaches the end of the cell, or until something interrupts the process. |
Summary of points of importance:
1. When the active zone in an axon or myofiber approaches an electrode from a distance the net result is first, positivity (Figures 4A-C), then, when it nears the electrode, negativity predominates. Maximum negativity is reached when the active zone is directly under the electrode. (Figure 4D) As the wave departs the potential becomes less negative, then passes through zero and again becomes positive. As it moves off into the distance positivity diminishes and finally reaches zero if it reaches the end of the fiber without interruption. (Figures 4 E-G). The net result is a triphasic potential, first positive, then negative, then positive again. The hypothetical final configuration shown in Figure 4G is formed of sine waves.
Actually, axons and myofibers do not generate perfect sine waves. This is because repolarization is slower than depolarization, therefore the late positive phase is longer in duration than the early positive phase (Figure 5A).
Applications of the theoretical events to well-known phenomena.
A. A simple, triphasic potential.
|
|
Figure 5A. This EMG fibrillation potential is a typical triphasic action potential. Here, the positive phases are shaded yellow. The first phase is a small positive phase, the second phase is the spike, which is negative, and the third phase is positive. It has longer duration than the first positive phase because repolarization is slower than the initial reversal of polarity. |
B. Compound action potentials.
Nerve action potentials, ascending evoked potentials of the spinal cord, and motor unit potentials in EMG, are generated by multiple axons or myofibers. Often, the negative phase has multiple peaks because of dispersion caused by differences in conduction velocities of individual axons or myofibers; this configuration is referred to as a compound action potential. Nevertheless, compound action potentials are triphasic also (Figure 5B).
Click on an image to see a larger view.
|
|
|
Figure 5B. Evoked compound action potential ("ascending evoked potential") recorded from the spinal cord of a dog using interspinous process and subcutaneous electrodes. There are multiple peaks because the stimulus led to activation of groups of peripheral nerve and spinal cord axons having differing conduction velocities. Figure modified from Poncelet, 1999 6 with kind permission of the author. |
C. Diphasic action potentials.
If a cable potential arises near the recording electrode and travels the recorded potential will be diphasic, first negative, then positive. (Figure 6)
|
|
|
Figure 6. This recording from a motor nerve conduction velocity test shows a diphasic potential, first negative, then positive. The recording electrode was close to the end-plate zone of the muscle, therefore the action potential arose close to the electrode. As a result, there was no period when the active zone approached the electrode, thus there was no early positive phase. The active zone simply was propagated along the muscle fibers, traveling away from the electrode in both directions (and doubling the recorded amplitude). |
If an action potential approaches but does not pass the electrode, the recorded potential is diphasic: positive, then negative. This occurs where a fiber terminates after reaching the vicinity of the electrode or where the fiber has been ruptured, injured or blocked so that activity cannot move on past the electrode. Two well-known examples are shown: positive sharp waves in EMG and evoked injury potentials of the spinal cord.
"Positive sharp waves" in EMG are single muscle fiber potentials that are propagated toward but do not pass the recording electrode; this occurs because the fibers have been injured either by the electrode or by disease. Recorded at other points along the muscle fiber, they appear as fibrillation potentials. This accounts for their positive, then negative, configuration. The slowness of the latter part reflects the slowness of repolarization5. The final phase often is negative, depending on the exact location of the recording electrode with respect to the event. (Figure 7)
|
|
Figure. 7A. The configuration of this electromyographic positive sharp wave is typical. It results from propagation of a fibrillation potential to the electrode where it stops because of injury to the muscle fiber by the electrode or by a disease process. |
Evoked injury potentials of the spinal cord. Spinal cord injury or compression will partially or completely block the ascending evoked potentials (AEP) of the spinal cord (i.e., potentials evoked by stimulation of peripheral nerves and recorded from electrodes placed adjacent to the spine). Electrodes placed near the lesion will record potentials that have the same shape as positive sharp waves in muscle fibers, differing only in time course and amplitude (Figure 7B).
|
|
Figure 7B. Recording made from a dog after intervertebral disk protrusion at T13/L1. Evoked injury potentials (highlighted zone) were recorded by an electrode in the interspinous space at T13/L1 after stimulating left and then right tibial nerves near the hocks. |
Poncelet has shown that the amplitude and exact configuration of these potentials can be used to estimate the extent of spinal cord damage after acute intervertebral disk prolapse and spinal cord compression.7
Positive sharp waves in the EMG and the evoked potentials recorded near a spinal cord lesion are simply the equivalent of "injury potentials" or "killed-end potentials" recorded from peripheral nerves by physiologists. Their configuration differs because they are recorded from "bipolar" electrodes in a volume conductor whereas the physiologists' potentials are recorded from electrodes placed directly on the nerve, often using "monopolar" derivations.8
D. Measurement of latency.
Theoretically, in motor or sensory nerve conduction velocity studies, latency could be accurately measured from the point where the potential first becomes positive, thus identifying arrival of the fastest conducting fibers. However, detectability of the onset of the positive phase varies with distance of the electrode from the nerve or muscle fibers, with the amplitude of the approaching potential and with technical factors in the recording system. The negative peak would be desirable theoretically also, because it reflects the passage of maximum negativity by the electrode (Figure 4D). However, this peak is sometimes rounded, making the actual maximum difficult to identify. When triphasic potentials are used for measuring latency, most workers now use the peak where the wave first changes from positive-going to negative-going. In motor nerve conduction velocity testing, it is possible to find in some muscles an electrode position where the first deflection is negative (for example, see Figure 6 above). This position is at the endplate zone and is desirable because it prevents the slow conduction velocity of muscle fibers from affecting the latency. Measuring latency from the onset of negativity in diphasic potentials of this type is simple and repeatable with modern equipment. Such an electrode position is difficult or impossible to find in some muscles. No analogous location exists in sensory nerve conduction velocity studies.
Part B: Stationary Sources
Electroencephalographic Potentials. The potentials recorded in the EEG, parts of cord dorsum potentials, and most peaks in other evoked potentials, are generated by stationary sources. They stand in contrast to the moving sources of the action potentials of axons in the nervous system and muscle fibers (described in Part A). Nevertheless recording of potentials generated by stationary sources is governed by the same four principles that govern recording the potentials of moving sources: Dipoles; Volume Conduction; Solid angles; Summation.
EEG potentials are considered here; other stationary or mixed sources are considered in Parts C and D. Gloor's paper 3 is relied on heavily here and readers may wish to refer to it for additional details. Other excellent background material can be found in works by Knott, Lorente de No and Woodbury.1,2, 4, 5
Dipole Formation in EEG Potentials. To understand their appearance and behavior, the source of the EEG currents must be considered. It is now generally agreed that the EEG arises primarily from the electrical activity of pyramidal neurons of the cerebral cortex. Glial cells have profound influences on the development and synaptic physiology of the cortex 9, 10 and they also contribute to the EEG, but this contribution results only in slow changes of potential that, for technical reasons, are not recorded in the usual EEG 11 (VNN, 1999). One might consider the action potentials of axons entering the cerebral cortex from the thalamus as possible sources of the EEG. However these axons have widely differing orientations and their potentials are very brief, thus they do not summate to levels that are detectable by electrodes not located in their immediate neighborhood. Importantly, thalamo-cortical axons synapse with pyramidal cells and it is these synapses that give rise to postsynaptic potentials, which are the actual EEG sources (PSPs). Even then, the events are too small to be recordable at the surface (Figure 8).
Click on an image to see a larger view.
|
|
Figure 8. Diagram of a cortical pyramidal cell after generation of excitatory postsynaptic potentials (EPSPs), triggered by a volley from thalamocortical axons. Positive charges have passed through the membrane channels, causing partial depolarization of the membrane potential and leaving the extracellular environs more negative than before the PSPs. Current flows throughout the extracellular region but is most intense at the interface (horizontal blue bar) between the active, more distal regions and the regions still at rest. The electrode "sees" all the current flows and registers a voltage change that is proportional to the solid angle (diagonal blue bar) and to the voltage difference at the interface |
Note the following important points:
1. Moving the recording electrode to various points around the circumference of the event will result in marked changes in the solid angle even though the event itself remains unchanged.
2. Electrode positions below the level of the interface will result in apparent reversal of polarity, even though the event itself remains unchanged.
3. If inhibitory postsynaptic potentials (IPSPs) had occurred, the polarity changes would have been in the opposite directions.
4. There are distinct analogies with the moving dipoles and stationary electrodes described in Part A.
Summation of EEG Potentials
To become recordable at the surface, PSPs must somehow summate to detectable levels. Summation occurs by anatomical and by physiological means: Anatomical means include the highly structured way in which the pyramidal neurons of the cerebral cortex are arranged in parallel layers, with apical dendrites pointing toward the cortical surface (Figure 9).
Because of the highly structured nature of the dendritic tree, these very small dipoles all have similar orientations. (Figure 10)
Thus, although too small individually to be detected by a distant electrode, the total, aggregated, activity of the dendrites comprises a solid angle sufficient to be detectable at a distance, even by an electrode located on the skin surface.3 (Figure 11).
Click on an image to see a larger view.
|
|
Figure 9. Three pyramidal cells from cerebral cortex of a rat, demonstrated by two-photon calcium imaging. The long white processes extending upwardly in the photograph are apical dendrites. They reach into the most superficial layers of the cortex and have processes extending laterally as well. From the somata, basal dendrites extend laterally and axons extend downward. In the background are processes of other pyramidal cells. Two photon calcium imaging entitled "Layer 5 Triplet". |
|
|
Figure 10. Diagram showing multiple synapses of one thalamocortical axon with the apical dendrites of pyramidal cells of the cerebral cortex. Individually, the PSPs generated by these synapses are too small to be detected at a distance. However, connection of one thalamic cell with multiple pyramidal cells results in nearly simultaneous PSPs at numerous sites, thereby increasing the total solid angle presented to the recording electrodes and creating a spatial summation of postsynaptic potentials. |
|
|
Figure 11. Schematic diagram showing how spatial summation of single dendritic PSPs permits recording EEG potentials at a distance. Action potentials arriving on a single thalamocortical axon almost simultaneously initiate PSPs at synapses on many pyramidal cells. Although too small to be detected individually by a distant electrode, the total, aggregated activity of the dendrites forms a solid angle sufficient to be detected by a remote electrode, even one located on the skin surface. (Refer also to Figure 8 and Figure 10) |
Important physiological characteristics are:
1. PSPs generated at thalamocortical synapses have much longer durations than axonal action potentials (10x-30x); this increases the probability of overlapping in time, allowing summation to even higher levels.14
2. Some PSPs do not result in reversal of polarity: They produce only a subthreshold change in voltage. Because this change is subthreshold, it is not necessarily propagated throughout the cell nor along its axon but simply spread electrotonically for a short distance away from the receptor. Contrast this characteristic with axons and myofibers which, when threshold is reached, undergo reversal of polarity and all-or-none propagation throughout their length.
3. PSPs cause polarity changes in either direction, negative or positive, depending on the nature of the synapse. When an excitatory synapse is activated, positive charges (ions) enter the dendrite or cell body; thus its membrane potential, normally negative, is made less negative and is brought closer to threshold. At the same time, the local extracellular space, having lost positive charges, becomes more negative with respect to more distant tissue; thus a negative change is registered by a recording electrode in the vicinity. When an inhibitory synapse is activated, exactly opposite changes occur (see also reference 11, VNN, 1999).
4. Recent research has revealed even more information that is relevant to EEG synchrony. Changes of potential in the soma can cause retrograde current flow into the dendritic tree and produce changes in the membrane potentials of the dendrites. Until recently, PSPs were thought to cause dendrites to undergo only electrotonic changes in membrane potentials. Now, it is known that there are voltage-gated sodium and potassium channels in some cortical dendrites.15,16 The voltage-gated channels, and the electrotonic changes resulting from conventional PSPs, have been shown to result in action potentials being propagated in the dendrites. These can propagate toward the soma and contribute to its membrane potential fluctuations or they can spread distally in the dendritic tree, or even be propagated throughout it.
5. Finally, there are dendrodendritic synapses between pyramidal cells,17-19 thus activity in the dendrites of one cell can lead to changes in the dendrites of other cells. These additional characteristics seem very likely to enhance the synchronization necessary to allow recording the EEG from the skin surface.
Summary of important points on summation: the solid angle of the dipole generated by a single cell is too small to produce a potential recordable at the surface, but the summation of solid angles created by the distribution and synchronization of events in groups of neighboring cells/synapses enables the EEG "waves" to be recordable at a distance, even as far away as the surface of the head.
Effects of Size and Orientation of the Dipole Layer
The small "slab" of tissue created by summated activity in neighboring active cells has been referred to as a dipole layer, 3,4 this is a very useful term and important concept (Figure 12). The surface area of the dipole layer and the orientation of the layer with respect to the recording electrodes have major effects on the recordability of electrical events in the dipole layer.
|
|
Figure 12. A hypothetical cortical dipole layer. Note the uniform orientation of the pyramidal cells and their apical dendrites. Here, excitatory PSPs have allowed movement of positive charges into the pyramidal cells, thus creating transient negativity in the local extracellular space, relative to more distant areas. Electrode E 1 "sees" only negativity, Electrode E 2 sees only positivity. The voltage recorded by the electrodes is proportional to the product of the solid angles and the actual voltage at the poles of the dipole (See Figure 1). Note that the voltages measured by E 1 and E 2 will differ from one another in amount as well as in polarity because the solid angles are different, even though the surface area of the dipole layer is the same on both sides. The minimum surface area required for recording the dipole layer with skin electrodes is said to be about 2.76 cm2 for human patients. Minimum surface areas for animals have not been established. |
Minimum Effective Size of Cortical Dipole Layer
Dipole layers can be too small to be recorded at the surface. It has been estimated that the minimum cortical surface area (=dipole layer area) necessary to generate a potential recordable from the human scalp is 6 cm2, equivalent to a circle having a diameter of about 2.76 cm20. The minimum areas in other species presumably might differ from human patients because of differences in thickness of CSF, bone, muscle and skin. At this time, we simply do not know the minimal area a cortical dipole layer must have in any given animal species for the cortical electrical activity to be recordable at the surface.
Effects of Orientation of the Dipole Layer with Respect to the Recording Electrodes.
A dipole layer can have infinite orientations with respect to surface electrodes. Each orientation will produce a unique result because of the effect on the solid angle the dipole presents to the electrodes. A few important effects of electrode orientations are illustrated here to demonstrate the principles involved:
A. Consider first a dipole layer located on the crown of a gyrus, with the exploring electrode directly over the dipole layer, as in Figure 13.
Click on an image to see a larger view.
|
|
Figure 13. Schematic diagram showing an imaginary cerebral gyrus after excitatory PSPs have caused partial depolarization of the pyramidal cells in the crown. The exploring electrode (E), located directly over the active dipole layer, registers negativity with respect to the reference electrode (R) , which is very remote, where the event has negligible effect on it.
Amp.: amplifier
CRO: cathode ray oscilloscope (or other display device).
E: exploring electrode
R: reference electrode |
B. Then compare Figure 13 with Figure 14 where the exploring electrode is located farther from the dipole layer and "views" it from a different perspective, both factors reducing the solid angle seen by the electrode.
|
|
Figure 14. Here, the exploring electrode is more distant from the dipole layer than in Figure 13; also, it sees the dipole layer at an angle. The reference electrode is still remote and has negligible effect on the recording.
In these circumstances, the solid angle seen by the exploring electrode is smaller and the deflection of the tracing is smaller. It is still negative because of the orientation of the dipole layer with respect to the electrode. |
C. Now consider a dipole layer on the crown of a gyrus recorded with a conventional "bipolar" electrode derivation. In a typical bipolar derivation both electrodes are influenced by the event. Compare this derivation (Figure 15) with Figures 13 and 14.
|
|
Figure 15. Conditions here are identical to those in Figure 14, except the reference electrode is no longer remote. In a bipolar derivation, preferred when recording EEGs clinically (VNN, 199911 ) both electrodes are influenced by the event. Note that the solid angle seen by the reference electrode is smaller than that seen by the exploring electrode. The net result is that the exploring electrode is more negative than the reference electrode. The differential amplifier, amplifying the difference between electrodes, causes an upward deflection of the CRO trace. The deflection is less than that in Figure 14 because the difference between electrodes is less. Direction of deflections is determined by conventions for displaying EEG.11(VNN, 1999) Note: If the locations of the two electrodes were reversed, the direction of the deflection on the display device would reverse; amplitude would remain the same. |
D. Finally, Figures 16A and 16B show the effects of locating the exploring and reference electrodes at various positions with respect to an imaginary dipole layer oriented vertically on the wall of a sulcus where it is perpendicular to the skin surface. This causes the individual dipoles making up the layer to be oriented horizontally, thus parallel to the skin surface. Dipole layers of this type give rise to EEG events termed "horizontal" or "tangential" dipoles.
|
|
Figure 16 A. Here, the dipole layer is oriented vertically to the surface. The exploring electrode is shown located at 3 different positions relative to the dipole layer. Once again, the reference electrode is remote and relatively unaffected.
Note the following important features:
1. If the exploring electrode is located directly over the dipole layer (e.g., at E-1), it sees equal amounts of negativity and positivity, therefore a flat tracing is produced.
2. If the exploring electrode were located left of the dipole (e.g., at E-2), it would see negativity and the tracing would deflect upwardly.
3. If the exploring electrode were located right of the dipole (e.g., at E-3), it would see positivity and the tracing would deflect downward. |
|
|
Figure 16B. Here, the exploring electrode remains fixed and the reference electrode is moved to different positions relative to a dipole layer that is oriented vertically to the surface;.
Note the following important features:
1. If the reference electrode were located on the skin surface at a position left of the exploring electrode (e.g., at R-2), it would register negativity and a downward deflection of the tracing would result.
2. If the reference electrode were located on the skin surface at the right of the exploring electrode (at R-3), there would be an upward deflection (direction of deflection is determined by internationally accepted conventions for displaying EEG.11 (VNN, 1999) |
Part C: Some Volume Conduction Characteristics of the Cord Dorsum Potential (Root-Entry Zone Potential): A Partly Stationary and Partly Moving Current Source
The cord dorsum potential (CDP) or root-entry zone potential (REZP) is composed of moving and stationary current sources. Under the usual recording conditions(Poncelet, 1999) , the CDP is composed of:
1. One or more early, small, brief (0.5-2 ms) positive deflections (A) that represent the arrival of action potentials in the stimulated (primary afferent) axons, thus these are moving sources. There may be additional small inflections that indicate the arrival of later action potentials in the endings of the stimulated nerve and/or additional secondary synaptic events in the gray matter (B, C)
2. A large, 5.5 ms duration negative peak (D) representing postsynaptic potentials in dendrites of neurons in the dorsal horn of the spinal cord gray matter. These are elicited by arrival of the action potentials at synapses in the spinal cord.
3. A lower amplitude but prolonged positive deflection, the duration of which may be 5-20 ms or more (E).This arises as a result of partial depolarization of the endings of primary afferent axons in dorsal roots of the spinal cord. This depolarization reflects pre-synaptic inhibition of the endings of the primary afferent axons. It extends retrogradely a variable distance along the axons in the dorsal roots far enough that it can be recorded even by electrodes placed directly on the dorsal roots; for this reason, it is known to physiologists as the "dorsal root potential". Unlike other nerve action potentials, it is simply an electrotonic partial depolarization and repolarization of the axons and thus does not generate the typical triphasic configuration of all-or-none potentials, as described in Part A. It too is a stationary current source and a field potential.21
Click on the image to see a larger view.
| Figure 17. | 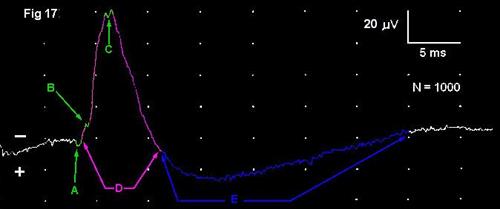
|
|
| |
The dipole layer generating the major peak of the CDP is located in the dorsal horn of the spinal cord gray matter. This was determined experimentally by moving a microelectrode in steps in a ventral direction through the spinal cord, beginning at its dorsal surface. The large negative peak first becomes larger, then, when the electrode reaches a specific point in the dorsal horn of the gray matter, the peak reverses polarity. When moved even more ventrally; it goes through changes that are the inverse of those it went through in dorsal regions.22 (Figure 18) This shows that the dipole layer generating this potential has its negative pole facing dorsally and its positive pole facing ventrally. At the dorsal edge of the spinal cord, the electrode sees the dipole layer as negative and as having a certain solid angle; as it approaches the dipole, the angle increases, therefore the amplitude increases. When the electrode is actually in the dipole, it sees exactly equal positivity and negativity and the potential recorded is zero. As the electrode moves farther ventrally, it goes through similar changes in amplitude but with apparent reversal of polarity because the electrode sees the opposite side of the dipole layer. These results indicate the dipole generator of this peak of the CDP is located in the dorsal horn of the spinal cord gray matter (Figure 18). Given the small size of the dorsal horn, the solid angle must be very small in its mediolateral dimension; however summation is achieved through longitudinal distribution of the dipole layer through one or more spinal cord segments in the dorsal horn.23
If a recording is made from the dorsal surface of the body (posterior surface, in human subjects) at the segmental level of the CDP dipole and then a second recording is made from the ventral (anterior) body surface, changes analogous to those of the needle electrode passing through the spinal cord are observed (Figure 18). These results suggest that a high amplitude of the large negative peak of the CDP might be recordable if the exploring electrode were placed on the dorsal midline and the reference electrode on the ventral midline. In testing this derivation we found that ECG artifact, which is in the millivolt range, tends to obscure the microvolt-sized CDP. Filtering out the ECG, or recording between ECG complexes,25could eliminate this problem. If so, this electrode derivation might prove to be useful clinically.
Click on the image to see a larger view.
|
Changes in Apparent Polarity of the Large Negative Peak of the Cord Dorsum Potential With Changes in Position of the Exploring Electrode
Based on experimental work in monkeys by Beall et al. and work with human patients by Seyal and Gabor22-24 |
|
|
Microelectrode recordings:
1.An electrode placed on the dorsal surface of the spinal cord position (A) records a negative peak.
2. An electrode at B would record a higher amplitude peak, still negative.
3. An electrode within the dipole layer would record zero potential.
4. An electrode at C would record a positive potential of the same amplitude as B.
5. An electrode at D would record a positive potential of the same amplitude as A.
6. An electrode on the ventral surface of the cord would record a positive potential. This would have smaller amplitude than A because position E is farther away from the dipole layer than is A.
Surface recordings:
1. An electrode on the body surface at F will record a negative potential
2. An electrode at G will record zero potential.
3. An electrode at H will record a positive potential. |
|
The changes in apparent polarity of the large negative deflection of the CDP result from the location of the electrodes with respect to the dipole layer. They are the equivalent of the so-called "instrumental phase reversal" seen in EEG work. Holliday and Williams, 1999. They would occur only with the cord dorsum potential; the conducted volley would not change its apparent polarity. |
Part D: Some Effects of Electrode Positions on the Brainstem Auditory-Evoked Potential (BAEP)
The location of electrodes used to record the BAEP has a marked effect on the configuration of the potentials recorded. This was studied in dogs by placing up to twenty exploring electrodes on the surface of the head. These were referenced to an electrode on the midline over the dorsal spinous process of the first thoracic vertebra (electrode "T 1" ), a site established as essentially inactive with respect to the BAEP (26 Holliday and Te Selle, 1985). Stimulating ipsilaterally or contralaterally to the various cephalic electrodes elicited potentials that differed greatly from those recorded from the commonly used vertex/ipsilateral-ear derivation. The effects on the first wave of the BAEP are presented in Figure 19 below, to illustrate the importance of electrode placements and some information their study can supply; it provides still another lesson in learning to tell up from down.
Click on the image to see a larger view.
|
|
Figure 19. The BAEP at left were recorded simultaneously from a dog using three different derivations:
A.: Exploring electrode at: the vertex (V), referenced to an electrode located immediately rostral to the base of the ear canal ipsilateral to stimulated ear (E). The BAEP has typical configuration for this derivation. The first wave is positive and has high amplitude.
B.: Electrode located at V referenced to an electrode located at the relatively inactive site on the dorsal midline over the first thoracic vertebra.(T1) The BAEP has typical configuration and amplitude for this derivation. Note the relatively low amplitude of the first wave, the appearance of small waves in the intermediate region and the high amplitude of the late wave.
C.: Electrode located at E, referenced
to T 1. Note the first wave is negative and has relatively high amplitude. |
|
|
These observations indicate the relatively high amplitude of the first wave of the BAEP in vertex-to-ear electrode derivations occurs because the reference electrode at the ear is located where it sees the negative end of the dipole layer generating the wave (trace C) and the vertex electrode sees the positive end (trace B). The commonly used derivation V-E (trace A, above) thus algebraically sums derivations B and C, resulting in the high amplitude of the first wave. Note that this is at the expense of absence of intermediate waves and lower amplitudes in the later waves of the BAEP. (See also,26.)
It is interesting to consider the possible influence of the stimulus characteristics on these results. For these experiments, half-sine wave, unfiltered clicks were used, thus the stimulus contained a specific, limited range of frequencies and could have activated maximally only on a limited length of the cochlear spiral. Conceivably, stimuli such as rectangular pulses, filtered clicks, or tone pips might stimulate somewhat different parts of the cochlea and produce differences in the apparent orientation of the dipole.
Concluding Remarks
The concepts of dipole layers, volume conduction, solid angles and summation are applicable to all forms of electrophysiology. They provide a unified or integrated basis for understanding the way in which bioelectric currents from any source are conducted in tissues and how this determines the appearances of the potentials recorded. The same concepts form the basis for topographic mapping of the EEG and evoked potentials, tools that doubtleessly will soon be applied in veterinary medicine.27,28All electrophysiological techniques require understanding these principles to produce and better understand recordings from any source.
References
1. Knott JR. Electrode montages revisited: How to tell up from down. Am J Electroencephalogr Technol 1969;9:33-45.
2. Knott JR. Further thoughts on polarity, montages, and localization. J Clin Neurophysiol 1985;2:63-75.
3. Gloor, P. J. Neuronal Generators and the Problem of Localization in Electroencephalography: application of volume conductor theory to electroencephalography. J. Clin Neurophysiol 1985; 2:327-354.
4. Lorente de No, in Stud. Rockefeller Inst. Med. Res. 1947, 132 (2):384-482.
5. Woodbury, J.W. in Neurophysiology by Ruch, T.C., et al. W.B. Saunders Co., Philadelphia 1965 p.85-91.
6. Poncelet L. Electrophysiological assessment of spinal cord function through somatosensory evoked potentials in dogs. Veterinary Neurology and Neurosurgery September, 1999. On line June 1999
7. Poncelet L, Michaux Ch, Balligand M. A study on the evoked-injury potential using dogs with naturally acquired thoraco-lumbar spinal cord disease and computer modeling. Am J Vet Res 1998; 59: 300-6.
8. Kimura J. Electrodiagnosis in Diseases of Nerve and Muscle. Principles and Practice. Ed 3 Oxford University Press, 2001.
9. Pfrieger FW, Barres BA. Synaptic efficacy enhanced by glial cells in vitro. Science 1997;277:1684-168
10. Oliet SHR, Piet R, Poulain DA. Control of glutamate clearance and synaptic efficacy by glial coverage of neurons. Science 2001;292:923-926.
11. Holliday TA and Williams C. Clinical electroencephalography in dogs. Veterinary Neurology and Neurosurgery. On line, May 1999
12. Landry P, Deschenes M. Intracortical arborizations and receptive fields of identified ventrobasa thalamocortical afferents to the primary somatosensory cortex in the cat. J Comp Neurol 1981; 199:345-371.
13. Landry P, Villemure J, Deschenes M. Geometry and orientation of thalmocortical arborizations in the cat somatosensory cortex as revealed by computer reconstruction. Brain Res 1982; 1982:237:222-226.
14. Guyton AC, Basic Neuroscience. Anatomy and Physiology. WB Saunders, Philadelphia 1991.
15. Martina M, Vida, I. Jonas, J. Distal initiation and active propagation of action potentials in interneuron dendrites. Science 2001; 287:
16. Stuart GJ and Sakmann B. Active propagation of somatic action potentials into neocortical pyramidal cell dendrites. Nature 1994: 367:69-72.
17. Haeusser M, Spruston N and Stuart, G. Diversity and dynamics of dendritic signaling. Science 2000; 290:239-244.
18. Segev I and London M. Untangling dendrites with quantitative models. Science 2000; 290:744-750.
19. Iino M, Goto K Wataru K et al. Science 2000; 292:926-929.
20. Cooper R, Winter AL, Crow HJ and Walter WG. Comparison of subcortical, cortical and scalp activity using chronically indwelling eledctrodes in man. Electroencpehalogr Clin Neurophysiol 1965; 18:217-22
21. Holliday TA. Electrodiagnostic Examination: Somatosensory evoked potentials and electromyography. In Moore, MP, Ed. Diseases of the Spine. Veterinary Clinics of North America, Small Animal Practice 1992; 22:823-857.
22. Beall JE, Applebaum AE, Foreman, RD Willis WD. Spinal cord potentials evoked by cutaneous afferents in the monkey. J Neurophysiol 1977: 199-211,
23. Seyal M, Gabor AJ. Generators of human spinal somatosensory evoked potentials. J Clin Neurophysiol 1987; 4:177-187.
24. Seyal M, Gabor AJ. The human posterior tibial nerve evoked potential: synapse dependent and synapse independent spinal components. Electroencephalogr and Clin Neurophysiol 1985; 62:323-331.
25. Holliday TA, Weldon NE, Ealand B. Percutaneous recording of eovked spinal cord potentials of dogs. Amer. J Vet Res 1979; 40:326-331.
26. Holliday TA and Te Selle ME. Brainstem auditory-evoked potentials of dogs: Wave forms and effects of recording electrode positions. Am J Vet Res 1985; 46:845-861
27. Fisch BJ. Special methods of analysis and recording. Chap. 7:23-138. in EEG Primer. Basic Principles of Digital and Analog EEG (third edition). Elsevier New York 1999.
28. Rodin E. The clinical use of EEG topography. Chap. 63:1190-1214 in Electroencephalography. Basic Principles, Clinical Applications, and Related Fields (fourth ed) Ed. Niedermeyer E and Lopes da Silva F.. Lippincott Williams and Wilkins. Philadelphia 1999.