Scalp and Thoracolumbar Recorded Somatosensory Potentials Evoked by Tibial Nerve Stimulation in Cats
Direct correspondence to:
Omer Besalti, Ankara University, Faculty of Veterinary Medicine, Department of Surgery, 06110 - Dışkapı - Ankara, Turkey, e-mail: besalti@hotmail.com, Fax: +90 3123164472, Tel. +90 3123170315
ABSTRACT
The purpose of this study was to define tibial somatosensory-evoked potentials (SEPs) in 56 clinically normal adult cats. The potentials recorded from the gastrocnemius muscle, sciatic nerve, L3-L4 and T12-T13 interarcuate ligament and scalp were evaluated. Central conduction time was determined by the difference between first scalp negative peak and first lumbar negative peak latencies. The initial small triphasic waves which represent the sensory nerve action potentials from sensory or mixed nerves into the spinal cord were observed in the lumbar area of 24 cats and in the thoracic area of 15 cats. The end point of the last positive potential was unclear. Amplitudes acquired from the muscle, sciatic nerve and scalp were conventional while the ascending evoked potential (AEP) was similar to that of the cord dorsum potential. According to the latency values, all the recorded potentials showed homogeneous dispersion except for the lumbar P1 and thoracic P2 latency values. The latencies of the lumbar and thoracic potentials' peaks were significantly different except for the lumbar and thoracic inter-peak and P2 and P4 latencies (P<0.05). This study concluded that the somatosensory-evoked and spinal cord-evoked potentials may be used to assess the functional integrity of the ascending tracts of the spinal cord, as well as sensory nerves, dorsal nerve roots and spinal cord dorsal horns in cats
KEY WORDS: spinal cord - electrodiagnostics - somatosensory-evoked potentials - cat
Introduction
Neurological examination and basic or enhanced imaging techniques have become the essential procedures for assessing the severity of spinal cord lesions. 1-3 The functional integrity of the spinal cord can generally be assessed by neurological examination, however electrophysiological examination is needed for precise diagnosis and prognosis in some cases. The anatomical location of the lesion may be diagnosed precisely by neuro-imaging, but some spinal cord dysfunctions can originate from a purely functional problem which can not be localised by imaging (e.g. spinal shock). Some of these limitations may be overcome by the study of motor-evoked potentials (MEPs) and/or spinal-evoked potentials (SEPs), which provide further information on the functional state of the descending and ascending tracts respectively. 4-8 The somatosensory-evoked potentials are another useful diagnostic aid to assess the severity of spinal cord compressions and brachial plexus disorders, and to monitor sciatic nerve function during hip and cauda equina surgery as well as spinal cord function during aortic surgery. 9-13
Somatosensory-evoked potentials have been described in more detail in dogs than in cats, in which there have been only experimental studies of central conduction velocity.8,14,15,16,17 To our knowledge, this is the first published investigation of spinal cord central conduction time in cats. The purpose of this study was to analyse tibial-evoked potentials in detail, to produce a clinically applicable method for recording SEPs in cats and to establish reference values.
Materials and Methods
Fifty-six healthy mongrel cats of different ages (3-5 years) and sexes were included in the study. Premedication with atropine sulphate (0.02 mg/kg, SC) and xylazine hydrochloride (2 mg/kg, IM) was followed by anaesthesia with ketamine hydrochloride (10 mg/kg, IM) as a single injection. The cats were positioned in left lateral recumbency and their rectal temperatures were monitored at regular intervals. Artificial tear drops were administered to the eyes to prevent corneal dryness during electrophysiological examination.
Eighteen mm. stainless steel disposable monopolar needle electrodes with a diameter of 0.3 mm, and length of 12 mm were used for all recordings and stimulations. The recording electrodes were attached to a 5-channel EMG/EP device (Medelec Synergy, Oxford). The filters for recordings were 3 Hz (-6dB/octave) - 3 KHz (-12dB/octave) with a sweep duration of 30 ms.
Stimulation Method - The cathode was inserted to a depth of 5-7 mm at the popliteal fossa close to the right tibial nerve and the anode was positioned subcutaneously about 2 cm cranial to the cathode. Stimulus strength was kept at a level that induced plantar flexion of the paw and enabled recording of a marked compound muscle action potential in the corresponding gastrocnemius muscle. Testing was performed to ensure that the impedance for the recording electrodes was lower than 2 kΩ before the start of each of the recording procedures. Rectangular electrical pulses lasting 0.2 ms were delivered to the tibial nerve. The stimulus intensity applied in order to produce visible flexion and compound action potential in the gastrocnemius muscle was 2 - 5 mA.
Recording method - The ground electrode was inserted subcutaneously on the right forelimb (Figure 1). The recording sites and the electrode placements were as follows:
Click on the figure to see a larger view.
| Figure 1. | 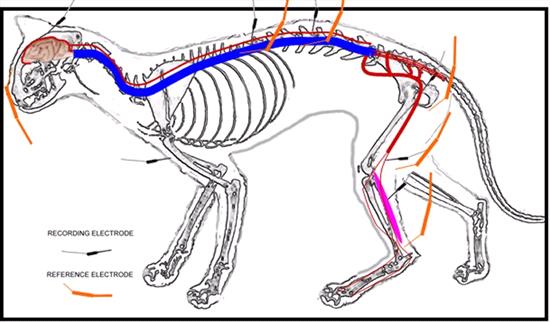
Diagram of the stimulation and recording sites used in the study to obtain somatosensory-evoked potentials. |
|
| |
Channel 1: Gastrocnemius muscle; the recording electrode was placed subcutaneously over the bulk of the right gastrocnemius muscle and the reference electrode over the tendon, subcutaneously.
Channel 2: Sciatic nerve; the recording electrode was placed in the right lesser sciatic notch and close to the nerve and the reference electrode was placed subcutaneously 2 cm caudal to the recording electrode.
Channel 3: L3 - L4 interarcuate ligament; the recording electrode was placed near the interarcuate ligament between the spinous processes and the reference electrode subcutaneously 1-3 cm lateral to the recording electrode on the right side.
Channel 4: T12 - T13 interarcuate ligament; the recording electrode was placed near the interarcuate ligament between the spinous processes and the reference electrode subcutaneously 1-3 cm lateral to the recording electrode on the right side.
Channel 5: Scalp; the recording electrode was placed on the C and the reference electrode on the Fz (EEG system), subcutaneously.
Approximately 250 responses were recorded and the procedure was repeated at least 3 times in every cat to ensure reproducibility. Traces showing inconsistency were excluded from evaluation. Artefact rejection was configured as follows: "off" at the first channel (gastrocnemius muscle), 500 µv at the second channel (sciatic nerve), and 50 µv at channels 3, 4 and 5 (lumbar, thoracic and scalp). Sweeps containing artefacts were totally rejected.
Measurement method - For the gastrocnemius muscle and the sciatic nerve, the latency was measured from the onset of the stimulus artefact to the first deflection from the base line. For the thoracic and lumbar recordings, the positive deflections which deviated downward from baseline were marked P1-P4 and the negative deflections which deviated upward from baseline were marked N1 - N3 respectively for evaluation of thoracic and lumbar potentials. The first negative peak was marked for the potential recorded from the scalp. The measurement points are presented in Figure 2. The difference between scalp and lumbar N1 (first negative deflection) latency was defined as the central conduction time. The differences between P4 and P1 values were estimated for inter-peak intervals for lumbar and thoracic potentials. Amplitudes were measured as peak-to-peak (the longest distance between the positive and negative deflections) except for channel 1 which was assigned for the gastrocnemius muscle. The potentials were also analysed with regard to their configurations.
Statistical analysis - The latency and amplitude values were analysed for homogeneity by using coefficient of variation. If the coefficient of variation result was below 20%, the distribution of values was considered homogeneous. The latencies of all deflections of the potentials recorded from the lumbar and thoracic areas were compared by using the Wilcoxon Signed Rank test. For all tests P<0.05 was considered significant.
Click on the figure to see a larger view.
| Figure 2. | 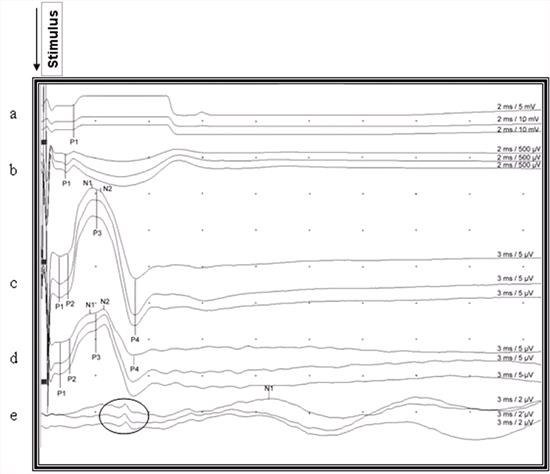
Recorded somatosensory-evoked potentials after stimulation of the right gastrocnemius muscle in a cat. The upward deviation from the baseline is negative and downward deviation from the baseline is the positive waveform, and all deviations were marked according to circumstances (P1, P2, P3, P4, N1, N2) for indicating latencies. Notice the reproducibility and small, brief far field potential of about the same duration as the P4 recorded from the scalp (encircled potentials) a: Gastrocnemius muscle, b: Sciatic nerve, c: Lumbar area d: Thoracic area, e: Scalp |
|
| |
Results
The observation of a gastrocnemius muscle potential and plantar flexion movement provided clear evidence of stimulation of the tibial nerve. The typical potentials consisted of an initial small triphasic wave (which was not seen in some cases) and a large negative wave (main negative potential) with or without sub-peaks. A prolonged positive wave was present in all recordings from both lumbar and thoracic areas. As the animals' body temperatures did not fall by 1oC, no adjustment was required in this regard.
When the moving sources of the cord dorsum potentials (CDP) were evaluated, P3 was observed in all except 2 cases. Peaks P1 and P2, which were seen in the initial small triphasic wave, were present in 24 cases (42.9%) in the lumbar area and in 15 cases (26.8%) in the thoracic area. A single P1 was detected for lumbar and thoracic potentials in respectively 22 (39.3%) and 17 (30.4 %) cases. In 10 (17.86%) cases neither P1 nor P2 was observed. When the presence of P1 and/or P2 in both lumbar and thoracic areas was compared, no significant difference was determined (P> 0.05).
The configurations of SEPs were similar in the lumbar and thoracic areas, where they were generally polyphasic. In the lumbar area, 39 (69.64%) cats had 3 waveforms, 14 (25%) cats had 4 and 3 (5.36%) cats had 2 waveforms. In the thoracic area, 42 (75%) cats had 3 waveforms, 9 (16.07%) had 4 and 5 (8.93%) cats had 2 waveforms. The initial small triphasic waves were not clear in cases in which both P1 and P2 were absent. The point where the large negative wave deflected from the baseline was considered as P1 (Figure 3). The 1st sub-peak of the large negative wave, and the 4th positive deflection (P4) was consistent in latency and amplitude measurement in all potentials recorded from the lumbar and thoracic areas. The potential recorded from the scalp was triphasic (positive - negative - positive) and the peak of the negative potential was consistent enough to measure the latency. However, there were small, brief potentials preceding the main potentials in 11 cats (Figure 2).
Click on the figure to see a larger view.
| Figure 3. | 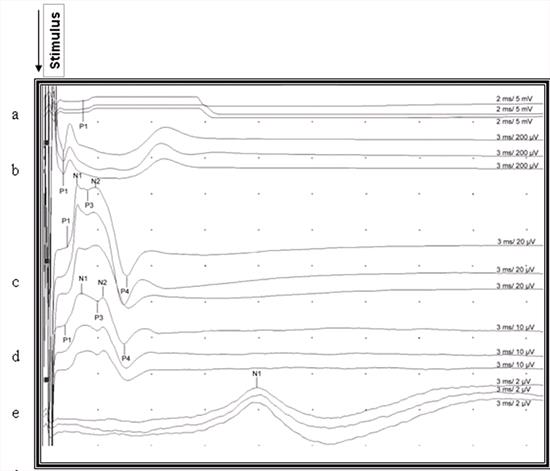
Recorded somatosensory-evoked potentials after stimulation of the right gastrocnemius muscle in a cat. P1, P2, P3, P4, N1, N2 indicate points for measuring of latencies. Notice the uncertain end point of the last positive waveform which was not marked in the lumbar and thoracic area. a: Gastrocnemius muscle, b: Sciatic nerve, c: Lumbar area d: Thoracic area, e: Scalp |
|
| |
The mean (±SD) amplitude value for the sciatic nerve potential was 248.444 ± 269.46 µv (108% CV). The SEP peaks' amplitude was 40.052 ± 33.20 µv (83% CV) in the lumbar area, 14.125 ± 9.6 µv (68% CV) in the thoracic area, and 1.94 ± 0.91 on the scalp (47% CV). The coefficient of variation was not homogeneous in the recorded potentials with regard to amplitude.
The mean onset latencies of the sciatic nerve and gastrocnemius muscle potentials were 0.791 ± 0.11 ms (14% CV) and 1.429 ± 0.55 (38% CV), respectively. The mean latency values of lumbar and thoracic area recorded potentials with coefficient of variation percentages are shown in Table 1. The mean N1 latency in the lumbar potential was 2.219 ± 0.279 ms (12.553% CV), in the thoracic potential 2.599 ± 0.350 ms (13.479% CV), and on the scalp potential 11.90 ± 0.291 ms (2.4% CV). The mean N2 latency in the lumbar potential was 3.196 ± 0.407 ms (12.736% CV) and in the thoracic potential 3.608 ± 0.267 ms (7.394 CV). The mean durations of inter-peak interval (P4-P1) between lumbar and thoracic potentials were not significantly different (P>0.05). According to the latency values, all the recorded potentials showed homogeneous dispersion except for the lumbar P1 and thoracic P2 latency values. The mean central conduction time was 9.950 ± 0.224 and the coefficient of variation was 16.533%. According to the coefficient of variation, the amplitudes of the potentials were not homogeneous.
Table 1. The mean latency values of the recorded Somatosensory-evoked potentials in the L3 - L4 and T12-T13 areas. When the coefficient of variation values is lower than 20% this was regarded as homogeneous
|
|
Lumbar |
Thoracic |
|
Latency ms± SD |
Coefficient of Variation |
Latency ms± SD |
Coefficient of Variation |
|
P1 |
1.241±0.256 |
20.667 %CV |
1.181±0.232 |
19.618 %CV |
|
P2 |
1.520±0.144 |
9.543 % CV |
1.807±0.527 |
29.191 %CV |
|
P3 |
2.653±0.341 |
12.862 %CV |
3.048±0.358 |
11.745 % CV |
|
P4 |
5.122±0.587 |
11.456 %CV |
5.054±0.528 |
10.450 %CV |
|
Interpeak Interval(P4-P1) |
3.881±0.606 |
15.609 %CV |
3.873±0.534 |
13.780 % CV |
|
N1 |
2.219±0.279 |
12.553 %CV |
2.599±0.350 |
13.479 %CV |
|
N2 |
3.196±0.407 |
12.736 %CV |
3.608±0.267 |
7.394 % CV |
Discussion
Several protocols for experimental and clinical studies in both dogs and cats have been described, in which evoked potentials were recorded from the scalp and from various spinal levels after peripheral nerve stimulation. 8,18-21 Although recordings from the epidural area are preferred by some,16,22, 23 recordings from the skin surface, cancellous bone of spinous processes, paraspinal muscle, subcutaneous tissue or the interarcuate ligament have also been reported in the veterinary literature. 4,5,7,8,16-19 The closer the recording electrodes are placed to the spinal cord, the greater the amplitude and latency obtained and resolution of the CDP.7,8,12 In this study, the recording electrode was inserted over the interarcuate ligament in cats, and clear and reproducible results were obtained.
The technical difficulty of this recording method lay in inserting the needle close to the interarcuate ligament. It was easier to insert the needle in the lumbar area than it was in the thoracic area. This may be due to the narrower inter-vertebral space in the thoracic area. SEPs recorded from the thoracic area were often obscured by an artefact caused by chest movements during spontaneous respiration. This problem was resolved by inserting a reference subcutaneous electrode over the paraspinal muscles.
The number of afferent nerve fibres activated by electrical stimuli influences the configuration and amplitude of the SEP. When the nerve is stimulated more proximally, movement of the limb may interfere with the recording. For this reason, distal stimulation of the tibial nerve between the calcaneal tendon and the tibia is preferred. 5,7,14 According to our results, when the tibial nerve is stimulated from the popliteal fossa, it is possible to record the compound muscle action potential from the gastrocnemius muscle and trigger plantar flexion. With supra-maximal stimulation, CDP without interference from whole hind limb movement were recorded.
The location of the reference electrode varies in different studies. While some authors prefer to position it approximately 1 - 3 cm cranially on the dorsal midline,4,18,19,21 others prefer to insert it over the paraspinal muscle.7 The best results were achieved by positioning the reference electrode subcutaneously over the paraspinal muscle. The distance between the recording and reference electrodes was thus optimised as approximately 2-3 cm.
The tibial SEPs have been used to evaluate the function of the ipsilateral dorsal spinocerebellar tract and the contra-lateral ventrolateral tracts with respect to the side of the stimulated limb.5 Four contributions to the SEPs are detected along the spine after tibial nerve stimulation:
1. At the L7-S1 level, the nerve root component is recorded,
2. At the caudal lumbar area (lumbar intumescence), the CDP is prominent,
3. Rostral to the recording of the CDP, an ascending volley is recorded,
4. At the level of the cisterna magna, the medullary component may appear.8
Holliday reported the CDP as partly stationary and partly moving current sources.15 The waves of moving sources (initial small triphasic wave and large negative wave with or without subpeaks) which are well represented by Holliday were not observed in all cases in this study. In addition, the beginning of the large negative waves representing postsynaptic potentials in the dendrites of neurons located at the dorsal horn of the spinal cord were not clear enough to mark or to measure. This may represent the main cause of the non-homogeneity of the P1 value in the lumbar area and also in the thoracic area, which was at the borderline for heterogeneity according to coefficient of variation. In cases in which an initial small triphasic wave was recognized, the positive point of the first positive deflection was marked, but in cases where the triphasic wave was not recognized, the beginning of the large negative wave was measured as a P1 value. Although the first negative deflection of the potentials recorded from the scalp was seen in all cases and reproducible, there was a small potential observed at almost the same time as the appearance of P4 when recording potentials from the lumbar and thoracic areas in 11 cats (19.65%). The source of this far field potential could not be determined. This may represent volume conduction of the very high amplitude CDP and/or AEP to the electrodes.
The number of waveforms observed in the lumbar and thoracic potentials was not totally compatible with the study of Redding et al.18 This could be related to the calculation and recording methods. The localisation of the reference electrodes in particular alters the configuration of the potential.22 We located the reference electrode 1-3 cm lateral to the recording electrode on the right side and calculated negative deflection in contrast to the study of Redding et al18 in which a coaxial needle electrode was used, and the reference electrode inserted cranial to the active electrode. The characteristic features of the CDP are an initial small triphasic wave followed by a large negative wave, which often contains 1 or 2 smaller sub-peaks, and a long latency. The small triphasic wave represents the sensory nerve action potentials propagating into the spinal cord by afferents. The large negative wave represents dorsal horn interneuron depolarisation. The last observed prolonged positive wave which is a stationary current source and a field potential represents primary afferent depolarisation in the stimulated segment and its dorsal nerve root. 5,7,8,15 In this study the P3 was seen in all cases except for 2, but the same did not apply to P1 and P2 deflections which represented sensory nerve action potentials in both lumbar and thoracic potentials. The end point of the last waveform of the potential was not highlighted by authors 8,15 but it can be inferred from the potentials presented by them. In our study this point was unclear and for that reason we preferred the difference between P4 and P1 for inter-peak interval (Figure 2). The durations of inter-peak intervals in the lumbar and thoracic potentials were not significantly different (P>0.05). In the light of this finding, it can be suggested that both are of the same duration and represent the main potential except for the initial triphasic wave.
As expected, the sciatic nerve action potential had the highest amplitude because the recording electrode was very close to the nerve, the distance between the stimulation and recording sites was short and the temporal dispersion of the propagating potential was low, and the sciatic nerve potential arises from a peripheral mixed nerve that includes motor nerve fibre potentials, while the spinal recordings are projected by the sensory system.
The lumbar potential amplitudes were higher than the thoracic potentials, as previously reported in the literature.8 Some authors reported that a decrease greater than 50% in the amplitude is diagnostic of irreversible changes in the spinal cord when encountered in the monitoring of spinal cord function during aortic surgery or in some spinal cord disorders.21,22 In this study, the amplitude at T12 - T13 in this study was higher than that reported by Redding et al18 (in which measuring method is not clear), and lower than found by Nordwall et al16 (1979) who recorded the potentials from the cancellous bone of the spinous processes. In the present study, we found that the SEP"s amplitudes were too variable to be useful in the assessment of the functional state of the spinal cord.
In a number of studies on latency, a relatively large range of values has been reported, for examination of spinal cord conduction. 5,14,19 There is still no consensus in the literature on the determination of diagnosis or prognosis based on latency. In all cases, the onset latency was not prominent enough to register in the lumbar and thoracic areas. Even though the latency values of this study were similar to the study of Redding et al, 18 there were major differences compared to Sims and Selcer's.19 The central conduction velocity was calculated by some authors.4,16,17,18 Because the spinal cord is not in a straight line along the vertebral canal, which bends dorso-ventro-dorsally, the actual length of the spinal cord is longer than the measured distance, which could result in erroneous calculations of conduction velocity.18 The central conduction time is extensively used by electro-physiologists to obtain information about spinal cord or brain dysfunction. It constitutes a good screening test for the functional assessment of the central sensory pathways.25,26 To our knowledge, the central conduction time has not previously been reported in cats. The values obtained in this study provide a baseline to help in the assessment and prognosis for disorders of the spinal cord and brain, but further studies of clinical cases are needed for any definite conclusions may be drawn.
This study shows that the assessment of spinal cord function by means of SEP requires taking into account the configuration of the potential, the latency values, the central conduction time and the inter-peak latency recorded from the thoracic and lumbar areas of the spinal cord, as well as the recording methods.
References
1. Hoerlein BF. Canine Neurology, Diagnosis and Treatments. 1965: pp 7-23. Philadelphia W.B. Saunders.
2. Sande RD. Radiography, myelography, computed tomography and magnetic resonance imaging of the spine. The Veterinary Clinics of North America, Small Animal Practice 1992; 22,4: 811-831
3. Wheeler SJ, Sharp NJH. Small Animal Spinal Disorders Diagnosis and Surgery 1994: pp 31 - 55. Mosby Wolfe Co. London.
4. Holliday TA, Weldon NE, Ealand BG. Percutaneus recording of evoked spinal cord potentials of dogs. American Journal of Veterinary Research 1979;40(3): 326-333.
5. Powers SK, Bolger CA, et al. Spinal cord pathways mediating somatosensory evoked potentials. Journal of Neurosurgery 1982;75: 472-482.
6. Van Ham LML, Mattheeuws DRG, Vanderstraeten GGV. Transcranial magnetic motor evoked potentials in sedated dogs. Progress in Veterinary Neurology 1994; 5: 147-154.
7. Cuddon PA, Delauche AJ, Hutchison JM. Assessment of dorsal nerve root and spinal cord dorsal horn function in clinically normal dogs by determination of cord dorsal potentials. American Journal of Veterinary Research 1999; 60(2): 222-226.
8. Poncelet L. Electrophysiological assessment of spinal cord function through somatosensory evoked potentials in dogs. Veterinary Neurology and Neurosurgery Web site. Available at https://www.vin.com/VNN/Journal.plx?AID=1471082.
9. Bailey CS. Patterns of cutaneous anaesthesia associated with brachial plexus avulsion in the dog. Journal of American Veterinary Medical Association 1984; 185: 889-99.
10. Laschinger JC, Cunningham JN Jr., Baumann FG, et al. Monitoring of somatosensory evoked potentials during surgical procedures on the thoracoabdominal aorta. Journal of Thoracic and Cardiovascular Surgery 1987; 9: 260-5.
11. Thompson SE, Moore MP, Lincoln JD, et al. Intraoperative monitoring of sciatic nerve function with somatosensory evoked potentials. Veterinary Surgery 1990; 19: 276-82.
12. Poncelet L, Michaux CH, Balligand M. Somatosensory potentials in dogs suffering naturally-acquired thoracolumbar spinal cord compression. American Journal of Veterinary Research 1998; 59:3. 300-306
13. Kim NH, Yang IH, Song IK. Electrodiagnostic and histologic changes of graded caudal compression on cauda equina in dog. Spine 1994; 19(9): 1054-62.
14. Poncelet L, Michaux CH, Balligand M. Effect of body size on tibial somatosensory evoked potentials in dogs. American Journal of Veterinary Research 1993; 54: 178-182.
15. Holliday TA. Volume conductıon principles in clinical neurophysiology. Part C. Veterinary Neurology and Neurosurgery. Web site Available at http://www.neurovet.org/Electrophysiology/VolumeConduction 2003.
16. Nordwall A, Axelgaard J, Harada Y. et al. Spinal cord monitoring using evoked potentials recorded from feline vertebral bone. Spine 1979; 4:486-494.
17. Sarnowsky RJ, Cracco RQ, Vogel HB et al. Spinal evoked response in the cat. J Neurosurg 1975; 43:329-336.
18. Redding RW, Lee AH, Wilson SG. Spinal evoked potentials and spinal conduction velocity of the cat: Reference values, American Journal of Veterinary Research 1984;45: 2175-7.
19. Sims, MH and Selcer RR: Somatosensory-evoked and spinal cord-evoked potentials in response to pudendal and tibial nerve stimulation in cats. American Journal of Veterinary Research 1989; 50(4): 542-545.
20. Purinton PT, Oliver JE, Kornegay JN, et al. Cortical averaged potentials produced by pudendal nerve stimulation in dogs. American Journal of Veterinary Research 1983; 44:446-8.
21. Steiss JE, Wright JC. Maturation of spinal evoked potentials to tibial and ulnar nerve stimulation in clinically normal dogs. American Journal of Veterinary Research 1990; 51: 1427.
22. Cracco RQ, Evans B. Spinal evoked potential in the cat: effects of asphyxia, strychnine, cord section and compression. ElectroEncephalography and Clinical Neurophysiology 1978; 44: 187-201.
23. Schramm J, Krause R, Shigeno T, et al. Experimental investigation on the spinal cord evoked injury potential. Journal of Neurosurgery 1983; 59: 485-492.
24. Ertekin C. Studies on the human electrospinogram, Part1: The origin of the segmental evoked potentials. Acta Neuroogica Scandinavica 1976; 53: 3-20.
25. Spehlmann R. Abnormal SEPs to leg stimulation. In: Evoked Potential Primer, Butter Worth, Boston, London 1985; 329-338.
26. Chiappa KH. Short latency evoked potentials: methodology. In: Chiappa KH ed. Evoked potentials in clinical medicine, Philadelphia: Lippincot-Raven, 1997; 283-340.