Lecture Summary
In order to be able to interpret an ECG it is first necessary to obtain an ECG of a good quality. A good quality ECG has the following characteristics:
1. It is clearly labelled and shows both vertical and horizontal calibration. If the filter is used this should be noted. Ideally a period of 50 mm/sec should be included on the trace and a prolonged "rhythm strip" of lead II recorded at 25 mm/sec.
2. It shows the minimum artefact throughout the majority of the recording.
3. All six frontal plane leads (I, II, III, avR, avL, avF) are recorded. Chest leads may be recorded.
4. It clearly shows details of the case from which it was recorded including the species and breed.
The ECG should be recorded with the patient in right lateral recumbency being gently restrained. Cats may tolerate the recording of an ECG better if they are in sternal recumbency. If right lateral recumbency is not used then this should be noted. Recumbency will not affect the cardiac rhythm but may alter the magnitude of some deflections. Sedation should be avoided if at all possible. Most sedatives will in some way alter the cardiac rhythm. The most profound effects on cardiac rhythm are seen when the alpha-2 agonists are used.
The ECG electrodes should be placed on the patient's limbs, on the forelimbs behind and slightly proximal to the elbow, on the hindlimbs cranial and proximal to the stifle. Good electrical contact should be ensured using the either coupling gel or surgical spirit.
The patient should be held on an electrically insulated surface and as far away from other mains electrical equipment as possible. Particularly avoid close proximity to strip lighting and computer screens. This should minimise the risk of 50 Hz interference.
Once the ideal recording environment has been achieved then recording can proceed.
Interpretation of the ECG
Basic interpretation of the ECG can be achieved by asking a few simple questions when faced with the ECG trace. The most important aspects of interpretation involve the determination of the heart rhythm and assessment of whether the rhythm is normal or not. The ECG may also provide clues as to the presence of enlargement of some cardiac chambers.
Is the ECG of a diagnostic quality? i.e., free from artefact, labelled and within the boundaries of the paper.
If the ECG is of a poor quality or not properly labelled then less information can be obtained. Subtle changes can be missed when there is considerable artefact. The time to notice artefact is when the trace is being recorded as another trace can be recorded at that time.
Interpretation of Rhythm
What is the Heart Rate?
Many significant rhythm disturbances disturb the heart rate. Arrhythmias that lead to an increase in heart rate are described as tachycardias. Arrhythmias that lead to a decrease in heart rate are called bradycardias. Instantaneous heart rate can be calculated on the basis of the R-R interval from one complex to the next. An average rate can be taken by counting the number of depolarisations within 6 seconds and multiplying by ten. Where the rhythm is very irregular a more accurate rate may be obtained by counting over 12 seconds.
Rates are therefore calculated as below:
a) Method of calculation of average heart rate (paper speed 25 mm/sec):
A distance of 15 centimeters from one R-wave is inspected on the lead II ECG strip. The number of R-R intervals in this 15 centimeters is calculated to the nearest half interval. This number is then multiplied by ten to provide the average heart rate to the nearest five beats per minute.
b) Method of calculation of the instantaneous heart rate (paper speed 25 mm/sec):
If the R-R interval is x mm the instantaneous heart rate is calculated as
HR = 1500/x beats per minute.
Where the ECG is recorded at 50 mm/sec the heart rate is calculated as
HR = 3000/x beats per minute.
Determination of Rhythm
Evaluation of the heart rhythm involves examining the ECG for evidence of the normal relationship between the P-waves and the QRS complexes. This can be done in the following way:
Is There a P-Wave for Every QRS Complex?
Where a QRS complex arises without a normal P-wave it implies that the atria did not depolarise normally prior to ventricular depolarisation. This can occur when the depolarisation resulting in the QRS complex arises in the wrong place, or the atria are unable to depolarise normally. The possibilities are therefore either
 Ventricular depolarisation
Junctional depolarisation (The junction refers to the AV node and bundle of His)
Atrial standstill
Atrial fibrillation or
Sinus arrest with escape complexes
Is There a QRS Complex for Every P-wave?
If a P-wave is visible on the ECG and it is not followed by a normal QRS complex then there has been failure of conduction of the atrial depolarisation through the atrioventricular node in the normal way. This is described as atrioventricular block and can occur in many forms. There are three types commonly recognised and these are described as first, second and third degree AV block.
First degree AV block is a prolongation of conduction through the AV node. Second degree AV block is an occasional failure of conduction through the AV node and third degree AV block is complete failure of conduction through the AV node. In the latter case there must be an escape focus beneath the AV node to maintain ventricular depolarisation, albeit at a lower rate than normal.
Are the P-waves and QRS Complexes Consistently and Reasonably Related?
P-waves and QRS complexes may arise concurrently and yet not be related. This tends to show as an inconsistent relationship between the two and implies the presence of separate ventricular and atrial rhythms. This is described as atrioventricular dissociation.
Are the QRS Complexes and the P-waves All the Same?
Variation in the appearance of P-waves or QRS complexes may imply that they have originated from a different site or been conducted differently. This would normally suggest an abnormality of rhythm however some variation in P-wave amplitude can be normal in dogs and is described as a wandering pacemaker.
Is the Heart Rhythm Regular or Irregular?
If the rhythm is irregular is it regularly irregular or irregularly irregular. Normal rhythms tend to be either regular, or regularly irregular. An irregularly irregular rhythm is almost always abnormal. The most common rhythm of this type is atrial fibrillation; this sounds chaotic. Auscultation is a more sensitive way of determining the regularity of a rhythm.
What is the Mean Electrical Axis?
The mean electrical axis can be calculated from the magnitude of the deflection of the QRS complex in six leads. This may help to determine if chamber enlargement has taken place or if there is an abnormality of conduction such as a bundle branch block.
| 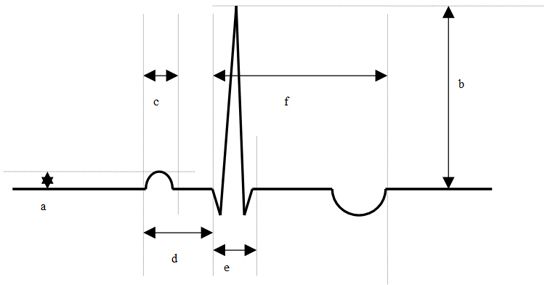
Determination of magnitude of deflections.
a = P-wave amplitude,
b = R-wave amplitude,
c = P-wave duration,
d = P-Q interval,
e = QRS duration,
f = QT interval |
|
| |
Where normal complexes are visible, i.e., those that appear to have arisen in the normal sequence from sino-atrial node to atrioventricular node to the ventricle, then measurement of the amplitude of the constituents of the complexes may be useful in providing information regarding the presence of chamber enlargement. There are a few patterns of chamber enlargement described.
Right atrial enlargement (RAE) may be represented by the presence of a tall P-wave, i.e., greater than 0.4 mV. This is sometimes also described as P-pulmonale.
Left atrial enlargement (LAE) may be represented by the presence of a wide P-wave, i.e., longer duration than 0.06 seconds. The P-wave may also become notched or M shaped. This is sometimes described as P-Mitrale.
Left ventricular hypertrophy (LVH) may be signified by the presence of tall R-waves, wide QRS complexes and a shift of the mean electrical axis to the left.
Right ventricular hypertrophy (RVH) may be signified by the presence of deep S-waves in leads I, II and III. There may be a shift of the mean electrical axis to the right.
Unfortunately none of these changes is specific to chamber enlargement. There is considerable overlap between normal animals and those affected by hypertrophy. For this reason the chamber enlargement suggested by the ECG must be interpreted in the light of other available information e.g., radiographs, echocardiography or post-mortem data.