Dawn M. Boothe, DVM, PhD, DACVIM, DACVCP
Department of Anatomy, Physiology and Pharmacology, College of Veterinary Medicine, Auburn University
AL, USA
INTRODUCTION
The first and most important step in the selection of an antimicrobial is identifying the target organism. For complicated infections, culture and susceptibility data (C&S) should be considered. Despite its pitfalls (to be discussed), C&S is an important--albeit one of several--guides to antimicrobial selection. Cultures always should be collected for serious (life or organ threatening) infections. For serious life threatening infections, cultures should be collected prior to initiation of antimicrobial therapy. Other indications for culture include but are not limited to chronic infections, recurrent infections, a history of previous antimicrobial therapy and nonresponsive infections. The utility of C&S data is enhanced when all information available to the clinician is used in the process. Simplistically, the information is most useful if the clinician compares what is needed to be effective against the microbe with what is achieved with the dosing regimen chosen. Comparison of the two--what is needed and what is achieved--may lead to important modifications in the design of the dosing regimen that might facilitate therapeutic success.
PHARMODYNAMIC/SUSCEPTIBILITY DATA: WHAT YOU NEED
Simplistically, susceptibility data represents "what is needed" in the patient to facilitate antimicrobial efficacy. Care must be taken with this simplistic approach: susceptibility data is generated from in vitro methodologies, yet it is applied to in vivo (and abnormal) conditions. As long as this caveat is foremost in the clinicians mind, the data can be useful to antimicrobial selection. Package inserts for newer antimicrobials include susceptibility data and as such, offer a means of understanding the role of susceptibility data in antimicrobial selection. Microbiological data for labels generally includes data generated both from agar gel disc diffusion (e.g., Kirby Bauer: zone diameters) as well as tube dilution (MIC) methods of susceptibility testing. However, the presentation of the "numbers" differ because the methodology differs.
The disk diffusion method (e.g., Kirby Bauer) uses disks impregnated with a known amount of drug that diffuses into the agar at a known rate. The agar is inoculated with a standardized number of organisms. The concentration of the drug decreases with the distance (zone) diameter from the disk. Microbial growth that is inhibited by the drug will result in a zone of no growth (zone of inhibition, diameter, in millimeters) that surrounds the disk. Antimicrobial growth that is inhibited at a large diameter indicates a susceptible organism because it is likely that the drug concentration in the agar that inhibited growth is low enough that it can be achieved safely in the patient. Growth inhibited only in close proximity to the disk indicates the need for a higher drug concentration in the patient. If it is unlikely that this concentration can be reached in the patient at the recommended dose, an "R" is designated for the drug. The zone diameters at which an organism is considered resistant is established by the National Committee for Clinical Laboratory Standards (NCCLS) of the Center for Disease Control (CDC) and generally can be correlated with an MIC of the drug (see tube dilution method). The disk diffusion method thus might be considered a qualitative method in that drug concentrations achieved in the agar surrounding the disk can be correlated roughly with concentrations achieved in the patient serum, but only "SIR" indicators are provided. Disc diffusion data on package inserts will include zone diameters indicative of organism susceptibility (S), intermediate (I), or resistance (R) (SIR). For example, current zone diameters for enrofloxacin at a dose of 2.5 mg/kg are > 20 mm = S (susceptible), < 16 = R (resistant), and between 17-19 mm = 1 (intermediate).
In contrast to disk diffusion, tube dilution methods involve inoculation of a series of test tubes with a standard number of organisms. The test tubes contain increasing concentrations of the drug of interest in twofold dilutions (e.g., 0.125, 0.25, 0.5, 1, 2, 4, 8 mg/ml etc) (Figure 1). Generally and ideally, the concentrations to be tested include the breakpoint MIC (MICBP; see below) and at least several fold dilutions of this MIC. Note, however, that some laboratories do not test at concentrations below the MICBP. Following a standard time, the tubes are evaluated for detectable growth. The test tube that contains the lowest concentration of drug and no visible growth contains the minimum amount of drug necessary to inhibit (not kill) the growth of the organism cultured from the patient (the MIC). Ideally, this concentration must be achieved at the site of infection. Adaptation to computerized/automated systems allow much more accurate testing in short time periods.
| Figure 1. | 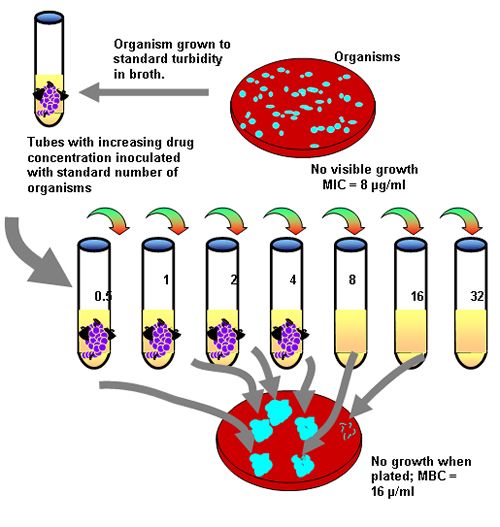
A diagram of tube dilution methodology. |
|
| |
For either method of susceptibility testing, simplistically, the likelihood of a drug being effective in the patient is based on whether or not the recommended dose on the label is likely to generate plasma drug concentrations (PDC) that equal or surpass the MIC of the infecting organism. Diagnostic laboratories indicate the likelihood of susceptibility by the "SIR" letter designation. Understanding the basis of that designation will facilitate antimicrobial selection. The SIR designation reflects whether or not the MIC of the infecting organism is less than ("S"), close or equal to ("I") or greater than ("R") the breakpoint MIC (MICBP) of the drug. Breakpoint MICs (as are interpretive zone diameters of agar gel diffusion) should be determined by the NCCLS and are the basis for determining the resistance or susceptibility of an organism to a drug. The MICBP is a characteristic of the drug, not the microbe, and as such, should be the same for all laboratories. The MICBP is determined by at least three criteria: the pharmacokinetics of the drug, particularly peak PDC (maximum concentration; Cmax;) that will be achieved in the targeted patient population, using the recommended dose of the drug (which should surpass MICBP); susceptibility (MIC) of the organisms which are included in the spectrum of the drug (e.g., the MIC 90, the MIC at or below which 90% of the organisms tested were susceptible; this should be below the MICBP); and clinical response to the drug as observed in a large number of patients. In Figure 2, the MICBP for each drug is noted in parenthesis to the right of the drug. If the MIC of the organism (noted for each drug for two organisms in Figure 2 is sufficiently lower than the MICBP, the organism is considered susceptible (S). If the MIC of the organism equals or surpasses the MICBP, the organism is considered resistant (R). Some laboratories also offer an "I" or "MS" (medium susceptibility), indicating that the MIC of the organisms is approaching (generally, within 1 tube dilution) the MICBP. Occasionally, for some drugs, more than one MICBP will be offered because selected species of organisms are more likely to be resistant. For example, it is not unusual for interpretive standards of beta lactams to be somewhat more restrictive (i.e., the MICBP is lower) for organisms which produce beta-lactamases. Examples can be seen in Table 1 for amoxicillin. Staphylococcus is considered resistant at a much lower MIC compared to gram negative organisms, indicating it is much more likely for those organisms to receive an "R" than and "S" designation. Note that some literature also provides a "susceptible" and a "resistant" MICBP. Closer examination indicates that the numbers often are the same. For example, in Table 1, for amoxicillin, an organism is considered susceptible if the MIC is < 4 µg/ml (the "susceptible" MICBP) but resistant if the MIC > 8 µg/ml (the "resistant" MICBP). However, both MICBP are saying the same thing since, for tube dilutions, there is not number between 4 and 8 µg/ml. For amikacin, an MIC < 16 µg/ml is considered susceptible, but > 64µg/ml is considered resistant. Organisms with an MIC of 32 µg/ml (the tube dilution in between 16 and 64) would be designated as an "I" or "MS".
| Figure 2. | 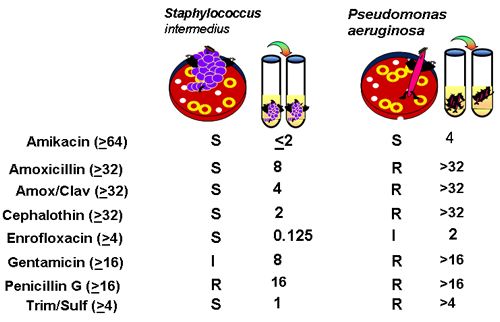
An example of C&S data (number in parenthesis is MIC BP) |
|
| |
Clinicians should be aware of the method of reporting microbial response for C&S reports for their laboratory. Some reports of susceptibility data provide an MIC of < X (where X = a drug concentration; see < 2 μg/ml for amikacin for Staph intermedius in Figure 2. For such organisms, no growth occurred in the lowest concentration tested by the laboratory, which generally (and hopefully), but not always, is several fold dilutions below the MICBP. An MIC of > X is accompanied by an "R" because the organism was not susceptible to the highest concentration tested (which generally is the MICBP). Prudent clinicians should be aware of the MICBP for drugs selected for treatment. To complicate interpretation further, some laboratories provide an interpretive "code" rather than MIC data that indicates a level of susceptibility of the culture organism. Provision of data which indicates the distance of the infecting organisms MIC from MICBP is particularly useful to the clinician in order to narrow the choice of "susceptible" drugs and to design the most appropriate dosing regimen for the patient.
The NCCLS updates MICBP particularly as new data is provided regarding organism susceptibility. Increasing resistance to organisms may lead to changes in the MICBP; ideally, doses of antimicrobials to which resistance is developing also should change, but unless a drug company is willing to subject the drug to approval (required for label changes) at the new dose, changes in labeled doses are not likely to occur. For older antibiotics approved decades ago, originally labeled doses may be inappropriate for all except very sensitive organisms. Enrofloxacin offers an example of how the NCCLS might change an MICBP Enrofloxacin was originally approved at 2.5 mg/kg. Peak drug concentrations at that dose are approximately 1.2 μg/ml. The NCCLS established the MICBP at 2 μg/ml. Thus, any organisms whose MIC was less than 2 μg/ml was considered susceptible; any organism with an MIC of 2 μg/ml or more was considered resistant. However, this concentration was probably too low for many organisms considered susceptible to enrofloxacin. Bayer Animal Health successfully sought a label with a higher dose that ranges from 5 to 20 mg/kg. The highest dose of 20 mg/kg yields PDC of approximately 4 μg/ml. Accordingly, Bayer sought and the NCCLS established a new MICBP: "S" = MIC <1 μg/ml, "R" = >4 μg/ml, and "F" (or "I") indicates an MIC between 1 and 4 μg/ml (new zone diameters for agar gel diffusion also were established). The "F" indicates "flexibility" in the selection of a dose. For the clinicians, based on MIC data alone, an S might indicate the lower dose should be considered, and an F, the mid to higher dose, depending on the proximity of the MIC of the infecting organism to the MICBP. The original MICBP, which many laboratories still use, does not reflect the higher dose and organisms identified as "R" might actually be susceptible at the higher dose. Veterinary microbiology laboratories should be encouraged by practitioners to implement changes in interpretive susceptibility data which reflect the flexibility in dosing regimens.
Table 1.
Minimum inhibitory concentrations (MIIC90 [µg/ml]) and breakpoint MIC (MICBP) of selected antimicrobials, for selected organisms (some data extrapolated from the human literature). An inhibitory quotient (IQ) has been calculated for E. coli. For some organisms, more than one report offered a MIC90, hence a range is given.
|
Drug |
E. coli
MIC 90 |
Kl. pneum
MIC 90 |
Pseu aeur.
MIC 90 |
MIC BP |
IQ for E coli |
|
Amikacin |
1-2 |
1-2 |
2-64 |
> 64 |
64 |
|
Amoxicillin (alone) |
>8-2048 |
>16-1024 |
2048 |
> 8 |
NA |
|
--with clavulanic acid |
8-16 |
8-32 |
32-512 |
|
|
|
Ampicillin |
8-512 |
>5122 |
-- |
> 16 |
2 |
|
Cefazolin |
2->128 |
4-32 |
-- |
>32 |
16 |
|
Cefotaxime |
0.06-16 |
0.125 |
<32-64 |
> 32 |
2-100 |
|
Cefoxitin |
4 |
8 |
-- |
>32 |
8 |
|
Cepha lex in |
8-32 |
8-32 |
>128->2048 |
> 32 |
4 |
|
Cephalothin |
8 |
16 |
-- |
> 32 |
4 |
|
Chloramphenicol |
128 |
512 |
-- |
> 32 |
NA |
|
Ciprofloxacin |
>.0075-.25 |
.03-0.25 |
0.012-1 |
> 8 |
(32->50) |
|
Doxycycline |
64 |
32 |
32 |
> 16 |
NA |
|
Enrofloxacin |
0.06 |
0.125 |
8 |
> 4 |
68 |
|
Gentamicin |
0.5-16 |
0.05->16 |
1->32 |
> 16 |
32 |
|
Imipenem/cilastin |
0.125-0.5 |
0.25-0.5 |
2-8 |
> 16 |
64 |
Tube dilution susceptibility will be presented on package inserts as minimum inhibitory concentrations (MIC). The MIC of an organism for a drug refers to the minimum amount of drug necessary to inhibit visible growth of an organism using standardized culturing methods as guided by the NCCLS which publishes guidelines for the methods of susceptibility testing as well as the interpretive criteria for each drug. The MIC data on a label may include: 1) the range of MIC for susceptible organisms; 2) the mode of MIC (the most frequently cited MIC); 3) or the MIC50 and the MIC90. The data are population statistics; the latter two reflect, respectively, the MIC below which 50% and 90% of the isolates (by genus and species) are inhibited (not killed). However, the MIC50 and MIC90 should be based on a large number of microorganisms to assure accurate sample representation of the population (ideally >300).
The Epsilon test ("E-test") represents a mix of agar gel diffusion and tube dilution. In this system, a several cm strip containing increasing concentrations of drug is applied to a plate inoculated with the infecting organism. The zone of inhibition (tear drop shape) surrounding the strip indicates the MIC of the infecting organism. Although expensive (one drug per plate; E-strips are expensive), an advantage of this system is that the range of MIC's is much larger than that offered by tube dilution. The author has used this system for drugs not included in automated assays and to identify the MIC of organisms noted as "R" using tube dilution when the infection is at a site where drug is or can be concentrated.
The different information provided by agar gel versus tube dilution methods may impact drug selection. For disc diffusion data, (and the E-test), the application to the clinical patient requires more hurdles than the application of MIC data in that zone diameters of disc diffusion correlate with MIC data.
PHARMACOKINETIC DATA: WHAT YOU GET
The selection of an antimicrobial should be based on the likelihood that therapeutic (effective) concentrations will be achieved at the tissue site. What is needed for therapeutic efficacy for infections is determined largely by the susceptibility (pharmacodynamic data) of the organism. For populations of microbes, the MIC90 provides an indication of what is needed; for organisms cultured from patients, the MIC as provided in C&S data is an indication of what is needed. Efficacy of an antibiotic is most likely to occur when the pharmacodynamic data is coupled with what is achieved in the patient. This in turn is best defined in pharmacokinetic data of the drug in the target species. Again, the availability on package inserts of pharmacokinetic data describing the disposition of drug in the target species can be a powerful tool for guiding design of a dosing regimen. For laboratories which provide MIC testing, the coupling of pharmacodynamic and pharmacokinetic data has already begun through provision of an S, I or R designation. However, the clinician can use the coupling of this information further to narrow the selection of appropriate antimicrobials and to design the dosing regimen.
Cmax or peak plasma drug concentration is generally determined following administration of a single (maximum) labeled dose using the labeled route in the target species. The value of this parameter is one of the 3 criteria for NCCLS determination of the MICBP of the drug. For the clinician seeking to improve antimicrobial efficacy, the further the MIC of the infecting organism is from the MICBPof the drug, the more likely effective concentrations will be reached at the site of infection. If a number of drugs are designated as "S", the selection might be narrowed by focusing on those drugs for which the MIC is furthest from the MICBP. Some labs do not provide the MICBP on their report. As noted before, a < X μg/ml designation indicates that the drug was susceptible at a concentration lower than the lowest concentration tested, indicating excellent susceptibility (if the laboratory tests at concentrations several fold lower than the MICBP. Alternatively, if the lab uses a numbering or lettering system, those drugs designated as having the lowest MIC might be the initial focus of selection. Finally, the MICBP of many drugs might be found on package inserts (including the Physician's Desk Reference or Veterinary Products and Biologics) or in the literature (as is provided in Table 1).
C&S data often reflects drugs not commonly used in animals. This reflects, in part, the availability of automated systems developed in human medicine because of economic considerations. Even for human drugs, cost of testing precludes generation of C&S data for all potential drugs of interest. Often, a single drug is tested as a representative of a class or subclass of drugs. Thus, ampicillin often serves as a model for amoxicillin, cephalothin for first generation cephalosporins, etc. Often, data of the representative drug fairly reflects that of similar drugs in the class. This is true for veterinary fluorinated quinolones. Enrofloxacin often serves as the model drug (as the first to be approved in the US). In general, bugs susceptible to enrofloxacin will be susceptible to other veterinary FQs and those resistant to one will be resistant to all. However, as seen in Figure 2, gentamicin could not serve as the model drug for amikacin (for both antibiotics). Third generation cephalosporins cannot reflect susceptibility data for all third generation cephalosporins.
For many drugs, C&S testing simply is not available because the manufacturer has not submitted data to NCCLS for determination of interpretive standards. This is particularly true for animal drugs, again, probably for economic reasons. Indeed, for drugs approved for use in both humans and animals, the interpretive standards used by a veterinary diagnostic laboratory may be those generated for human drug therapy, not animal drug therapy. Differences in Cmax (or in the pathology/physiology of the infecting organisms) may result in less clinical application in animals compared to humans. Clearly, susceptibility data for drugs for which no approved version exists in (non-human) animals is based on interpretive standards in humans. Finally, some laboratories provide only agar gel diffusion data. For such cases, data reported in the literature can be helpful in selecting both a drug and a dose. Assuming the organism is known, the MIC90 can be used as an alternative to MIC of the organism in the patient; and the reported Cmax of a pharmacokinetic study can be used in lieu of the MICBP. Table 1 provides Cmax or peak PDC at specific doses for selected antimicrobial drugs in dogs or cats when using the dose accompanying the Cmax. As expected, this approach has limitations. For example, using the MIC90will probably underestimate the efficacy of the drug because chances are the MIC of the infecting organism is below the MIC90. The MIC50or, even better, MIC mode (the MIC most frequently reported) might be a more clinically relevant MIC to which the Cmax could be compared when considering in vitro susceptibility of an organism to a drug. However, using the MIC90 will allow a conservative approach to antimicrobial selection.
DESIGNING A DOSING REGIMEN
For selection of a drug for which multiple drugs are noted as "S", the MIC of the infecting organism can be compared to the reported MICBP to assess "relative" susceptibility. Those drugs for which the distance between the two parameters is greatest might be the initial focus of drug selection. Note that comparisons can not be made by comparing MIC of different drugs. Just as drug concentrations vary in the patient, MIC concentrations also will vary. Drug susceptibility must be compared using relative susceptibility: the distance of the MIC of the infecting organism from the MICBPof the drug of interest. For example, in Figure 2, if C&S data were to be the only criteria for selection, amikacin might be the best choice to treat Staph since its MIC is 1/32 of the MICBP. Enrofloxacin might be a close second. Clearly, other considerations (especially ability to penetrate tissue) should narrow the initial list of susceptible drugs further and might, for some infections, be the initial basis for selection.
Once the drug has been selected, MIC data also can be used to design the dosing regimen, and specifically, in selecting a dose. A review of the package inserts of the veterinary FQs can exemplify this point. A review of the MIC90 of the various organisms for these drugs reveals considerable differences in susceptibility among the organisms (although MIC for the drugs are often very similar). For example, Pasteurella multocida generally is characterized by very low MICs (e.g., .06 μg/ml), whereas Pseudomonas aeruginosa generally is characterized by higher MICs (e.g., 1 μg/ml) for the FQs. Intuitively, when treating the former organism with an FQ, a lower dose is more likely to be effective. However, when treating the latter organism, a higher dose generally should be selected. The same approach can be used when using the MIC of an infecting organism provided by a diagnostic laboratory. The closer the MIC of the infecting organism is to the MICBP, the more likely the maximum dose (or higher) should be used. Although less ideal, the same approach can be used when basing dose selection on agar gel diffusion data or when the organism is suspected but not known. For disc diffusion data, only "S", "I" and "R" designations are given; no evidence of relative susceptibility is provided. However, the MIC90 data for the infecting organism on the PFL can help guide initial selection of a dosing regimen when only disc diffusion data is available. An "I" (or an MIC that approximates the MICBP) indicates the need for a higher dose, unless the infection is in located at a site in which the drug is concentrated (urinary tract infection) or the drug can be applied topically. Indeed, for such infections, C&S may markedly underestimate efficacy because the MICBP is based on drug concentrations achieved in plasma and does not reflect concentration of the drug. A dose can also be calculated based on the MIC of the drug, as long as the VD of the drug is known. For example, for treatment of Pseudomonas aeruginosa with enrofloxacin (VD = 2.7 L/kg), a dose can be calculated based on an MIC90 of 1 μg/ml (1 mg/L): Dose = 2.7 L/kg * 1 mg/L= 2.7 mg/kg. However, this dose will simply achieve the MIC in plasma and may not be sufficient for efficacy, particularly for concentration dependent drugs.