Rob. M. Christley, BVSc, DVCS, MVCS, DECVPH, PhD, MRCVS
Introduction
You will probably be familiar with many diagnostic tests, such as those based on the polymerase chain reaction (PCR) and the enzyme-linked immunosorbent assay (ELISA), and how they work. In this presentation, the author will not discuss technical aspects of diagnostics tests, but rather will address general questions about how we should interpret the results of a diagnostic test and how much we should rely on such results. Often when thinking of diagnostic tests we picture something that is done in a laboratory, such as a serological test. In fact, any process by which you arrive at a conclusion can be thought of as a diagnostic test, such as cardiac auscultation, condition scoring, lameness evaluation, even clinical judgment. Importantly, when using any of these 'tests' there is a chance that we will come to the wrong conclusion. Here, we consider how to evaluate a diagnostic test, how to determine the extent to which we can believe the results of the test, and how to think of strategies to use test results in making accurate diagnoses.
Consider a test that is designed to diagnose a particular disease. Imagine that we try this test out on a large group of animals in which we know the true disease status of each animal (through a 'gold-standard' test). We can record the results in a 2 x 2 table and calculate many useful indices (Figure 1).
The sensitivity (Se) and specificity (Sp) of a test are features of that particular test and, provided the test is always carried out under exactly the same conditions, should not change. The true prevalence of the disease is clearly a feature of the population being tested; the prevalence of a disease is likely to vary between populations. It is important to note that the predictive values, apparent prevalence and accuracy of a test vary depending on the true prevalence in the population being tested.
Figure 1. Selected indices relating to diagnostic tests.
|
|
True disease status |
|
|
Diseased |
Healthy |
Total |
|
Test result |
Positive |
a |
b |
a+b |
|
Negative |
c |
d |
c+d |
|
|
Total |
a+c |
b+d |
N |
Here we have tested a total of N animals. There are four possible outcomes for each animal, a, b, c or d;
a) The test is positive and the animal truly has disease--true positive
b) The test is positive although the animal is truly free of disease--false positive
c) The test is negative although the animal truly has disease--false negative
d) The test is negative and the animal is truly free of disease--true negative
From this table we can work out several useful indices:
 Test sensitivity = a/(a + c): The proportion of diseased individuals who are correctly identified by the test. The sensitivity tells us how good the test is at picking out disease-positive animals.
Test specificity = d/(b + d): The proportion of disease-free individuals who are correctly identified by the test. The specificity tells us how good the test is at recognising disease-free animals.
True prevalence of disease = (a + c)/N: The proportion of the population that is truly affected with the condition.
Apparent prevalence of disease = (a + b)/N: The proportion of the population that is diagnosed as being disease positive using the test.
Predictive value of a positive test result = a/(a + b): The proportion of individuals with a positive result who actually have the disease.
Predictive value of a negative test result = d/(c + d): The proportion of individuals with a negative result who are really disease free.
True and Apparent Prevalence
It is important to distinguish between the true and apparent prevalence of disease. Obviously, we are interested in the true prevalence (TP). However, we can only ever estimate the apparent prevalence (AP). How close the apparent and true prevalence are will be determined by the sensitivity, specificity and the true prevalence.
Predictive Values
As we have seen in Figure 1, the predictive value of a positive test result (PVP) is the probability that an animal that has tested positive actually has the disease in question. Similarly, the predictive value of a negative result (PVN) is the probability that an animal that has a negative test result is truly free of the disease. We can also think of this in another way. Imagine that you are using the test simply to categorise the animals in the population. Those that test positive, you call population P and those that test negative you call population N. For example, you test a population of 500 cats for feline leukaemia virus (FeLV) using a test with 90% sensitivity and 90% specificity (Figure 2). The true prevalence in the total population is 10%. Hence, if you randomly select a cat from the entire population, there is a 10% chance it will have FeLV (50/500). However, the true prevalence in population P is 50% (45/90), so, if you randomly selected a cat from this subpopulation, there is a 50% chance that it would be positive (this is the positive predictive value). In population N the true prevalence of FeLV is only 1.2% (100*[1-PVN]). Note that the apparent prevalence in the total population is 18% (90/500), considerably greater than the TP.
Hence, we can think of diagnostic tests as a way to reclassify a population into two subpopulations, one with a higher prevalence and the other with a lower prevalence. The better the test (higher Se and Sp) the greater will be the difference in prevalence between these subpopulations (i.e., the population P will have a prevalence closer to 100% and population N closer to 0%).
It is important to remember that, if you used this test on this population, the only information obtained is that in the right-hand column of Figure 2 (you do not know the true status of the animals) (Figure 3).
Because you do not have a perfect test, you cannot know for certain the disease status of each individual animal. The predictive values provide a way to help you interpret the results you have obtained by helping you to determine the probability that a given test result represents the truth. However, the predictive values are influenced by the disease prevalence.
Figure 2. Sensitivity and specificity of a test.
|
|
|
True disease status |
|
|
Population |
Diseased |
Healthy |
Total |
|
Test result |
Positive |
P |
45 |
45 |
90 |
|
Negative |
N |
5 |
405 |
410 |
|
|
Total |
|
50 |
450 |
500 |
Figure 3. Information obtained.
|
|
Population |
Total |
|
Test result |
Positive |
P |
90 |
|
Negative |
N |
410 |
|
|
Total |
|
500 |
The Effect of True Prevalence on Apparent Prevalence and Predictive Values
Let us consider the effect of true prevalence on the apparent prevalence and the predictive values by continuing the example from above. Imagine the same test (sensitivity and specificity 90%) was used to diagnose FeLV in cats from several populations (A, B, C and D), each with a different FeLV prevalence.
Figure 4 illustrates how both the predictive values of a positive (PVP) and negative (PVN) test and the apparent prevalence of a test change as the true prevalence changes. The test has the same sensitivity and specificity in each of the populations above: its ability to diagnose has not altered; the only thing that has altered is the prevalence of FeLV.
Figure 4. How predictive values of a positive and negative test and the apparent prevalence of a test change as the true prevalence changes.
|
|
Population |
|
A |
B |
C |
D |
|
True prevalence of FeLV (%) |
1 |
10 |
40 |
80 |
|
Apparent prevalence from test (%) |
10.8 |
18.0 |
42.0 |
74.0 |
|
Predictive value of positive test result (PVP, %) |
8.3 |
50.0 |
85.7 |
97.3 |
|
Predictive value of negative test result (PVN, %) |
99.9 |
98.9 |
93.1 |
69.2 |
What are the practical implications of this? Consider two scenarios:
You routinely test all cats for FeLV when you take a preoperative blood sample prior to performing neutering operations. Most cats sampled are young and healthy and the prevalence of FeLV in these cats is low, say 1% (i.e., as for population A). Now, 99.9% (the PVN) of cats that test negative truly do not have FeLV, which is great, and you feel you can believe a negative test result. However, of those that test positive only 8.3% actually have FeLV (91.7% are false-positives). If you knew this, would you bother testing in this way? What would you tell the owners of a cat with a positive test result?
A cat comes to your clinic with signs highly suggestive of FeLV. You have read in a journal of a study investigating the prevalence of FeLV in cats with similar signs, 80% of which truly had FeLV (i.e., as for population D). If the cat returns a positive test result, there is a high (97%, the PVP) chance that it really has FeLV. But, also note that 31% of cats with negative test results will actually be positive. Therefore, even if the result is negative, you may not be convinced that the cat does not have FeLV.
Note that the values for sensitivity and specificity used here are approximately those reported for a commercial ELISA (ClinEase-Virastat®). Many modern FeLV tests have considerably higher sensitivity and specificity (each approximately 99%). You can see from the diagrams in Figure 5 that such a test has high PVP and PVN within a prevalence range of 20-80% (bottom right graph in Figure 5). However, a very extreme (but perhaps realistic) prevalence may still result in considerable misdiagnosis. For example, a prevalence of 1% results in a PVP of 50% (and PVN of 100%). Note that even with such a 'good' test, if the prevalence is very low half the animals which return positive results may not really have FeLV!
Also note the general effect of sensitivity and specificity on the predictive values. Generally, as the sensitivity increases, the PVP increases; a test with a high sensitivity is good at ruling disease in. In contrast, as the specificity increases, the PVN increases; a test with high specificity is good at ruling a disease out.
Click on the image to see a larger view.
| Figure 5. | 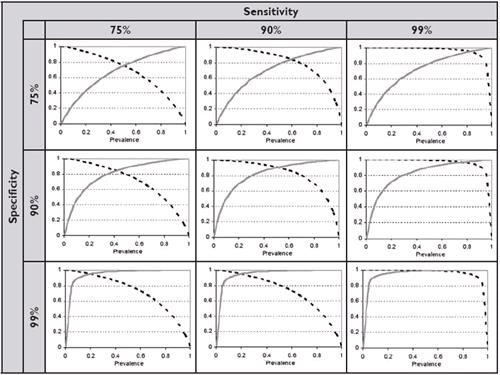
The effect of specificity and sensitivity on the predictive value of a positive test result (PVP, solid grey lines) and of a negative test result (PVN, dotted black lines). |
|
| |
A Strategy for Interpreting Diagnostic Tests in Practice
For any given test, you can maximise the PVP by ensuring the test is used in a population with a high prevalence. We often do this in practice by selecting animals for testing on the basis of clinical suspicion (e.g., the animal looks like it has a particular disease on the basis of a clinical examination), and/or on the basis of other positive results using other tests. In effect, we are selecting a subpopulation which is likely to have the disease, or in other words, has a high prevalence. This is known as serial testing and will maximise the overall PVP (at the expense of PVN) of the results of a collection of tests. An alternative method is parallel testing. Here a number of different tests are done and the animal is considered to have the disease if any one of the tests is positive. This method maximises the overall PVN at the expense of PVP.
Note that for serial and parallel testing, 'different' tests means independent tests, i.e., that measure different things, such as a test of antibody levels and a test of the presence of antigen.
Conclusion
Interpretation of the results of diagnostic tests needs to take into account the 'characteristics' of the test (namely the test's sensitivity and specificity) and the true prevalence of disease in the population being tested (or the probability of disease in the animal being tested). Particularly where the prevalence of disease is relatively extreme, even apparently 'good' tests (with high sensitivity and specificity) may give incorrect results. In practice, this is often particularly true when we are interpreting positive test results for conditions that are likely to be at very low prevalence; many of these will be false-positives. In such cases, the PVP can be improved through serial testing.