Abstract
Quantitative RT-PCR is often used for research in gene expression, and it is vital to choose appropriate housekeeping genes (HKGs) as reference genes to obtain correct result.4 To date, there is no study on selection of reference genes in cetacean blood. The purpose of this study is to determine stably-expressed HKGs in blood, which can be the appropriate reference genes in relative quantification in gene expression research. Thirty-two EDTA-anticoagulated blood samples were taken monthly from 4 beluga whales (Delphinapterus leucas) in National Museum of Marine Biology and Aquarium from November 2011 to September 2012, and were preserved in RNAlater® (Ambion). Total RNA was extracted using Ribo-PureTM-Blood kit (Ambion) following the manufacturer's instructions. RNA concentration was adjusted to 100 µg/mL following by cDNA synthesis using QuantiTect® Reverse Transcription kit (Qiagen). Sequences of 13 candidate HKGs (ACTB, B2M, GAPDH, HPRT1, LDHB, PGK1, RPL4, RPL8, RPL18, RPS9, RPS18, TFRC, YWHAZ) of cetaceans were obtained from GenBank. Primers and corresponding probes from Roche Universal ProbeLibrary (UPL) of the genes mentioned above were designed using Roche UPL design software (ProbeFinder, v.2.49). The quantitative gene expression analysis of the candidate genes of each sample were performed using real-time PCR (Eco, Illumina), and the stability values of the HKGs were determined by geNorm2 and NormFinder1 software. On the basis of the combined results from these two software, ACTB and RPL4 are the most stable HKGs in beluga whale blood (Figure 1, 2). Besides, it was speculated that using only two HKGs simultaneously as reference genes could have reliable results (Figure 3). Blood can serve as an indication of health status in cetaceans because changes of gene expression in blood is prior to hematology and chemistry findings.3 This research provides recommendation of reference gene selection, which may contribute to further mRNA relative quantification research in the peripheral blood leukocytes in belugas.
| Figure 1. geNorm output chart. Average expression stability measure (M) of control genes during stepwise exclusion of the least stable control genes. | 
Lower value means the expression is more stable. |
|
| |
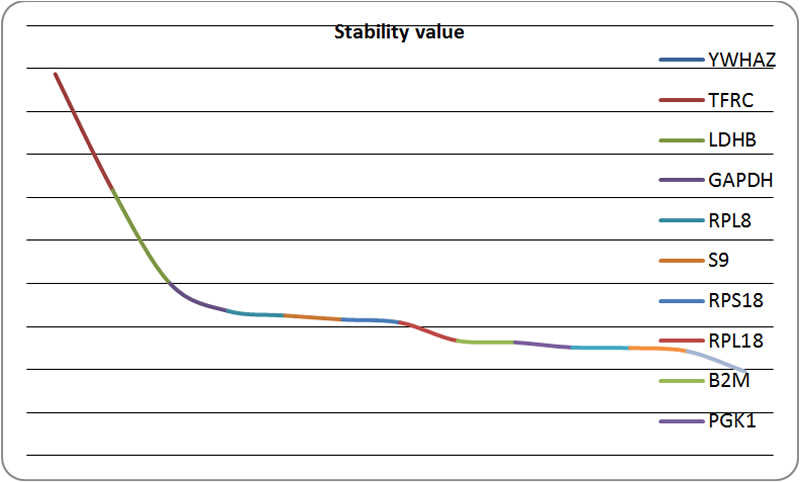
| Figure 2. Chart according to the results of NormFinder | 
The smaller of stability value represents the higher expression stability of the housekeeping gene |
|
| |
| Figure 3. geNorm output chart. Determination of the optimal number of control genes for normalization calculated on the basis of the pair-wise variation (V) analysis. | 
V values under 0.15 threshold line indicate no need to include further HKG for calculation of a reliable normalization factor. |
|
| |
Acknowledgements
A special thanks to the staff at National Museum of Marine Biology and Aquarium for all their support.
* Presenting author
+ Student presenter
Literature Cited
1. Andersen CL, Jensen JL, Ørntoft TF. 2004. Normalization of real-time quantitative reverse transcription-PCR data: a model-based variance estimation approach to identify genes suited for normalization, applied to bladder and colon cancer data sets. Cancer Res. 64(15):5245–50.
2. Currie KL. 1991. GENORM: A generalized norm calculation. Computers and Geosciences. 17(1): 77–89.
3. Lee CS, Sitt T, Bowen L, Blanchard MT, Smith BR, Stott JL. 2009. Transcriptional gene signatures in Tursiops truncatus: an aid in differential diagnostics? IAAAM 40th Annual Conference Proceedings, San Antonio, Texas; Pp. 51–52.
4. Spinsanti G, Panti C, Lazzeri E, Marsili L, Casini S, Frati F, Fossi CM. 2006. Selection of reference genes for quantitative RT-PCR studies in striped dolphin (Stenella coeruleoalba) skin biopsies. BMC Mol Biol. 7: 32.